


Blogs
Single-Cell RNA-Sequencing Data Curation Service & Data Showcase
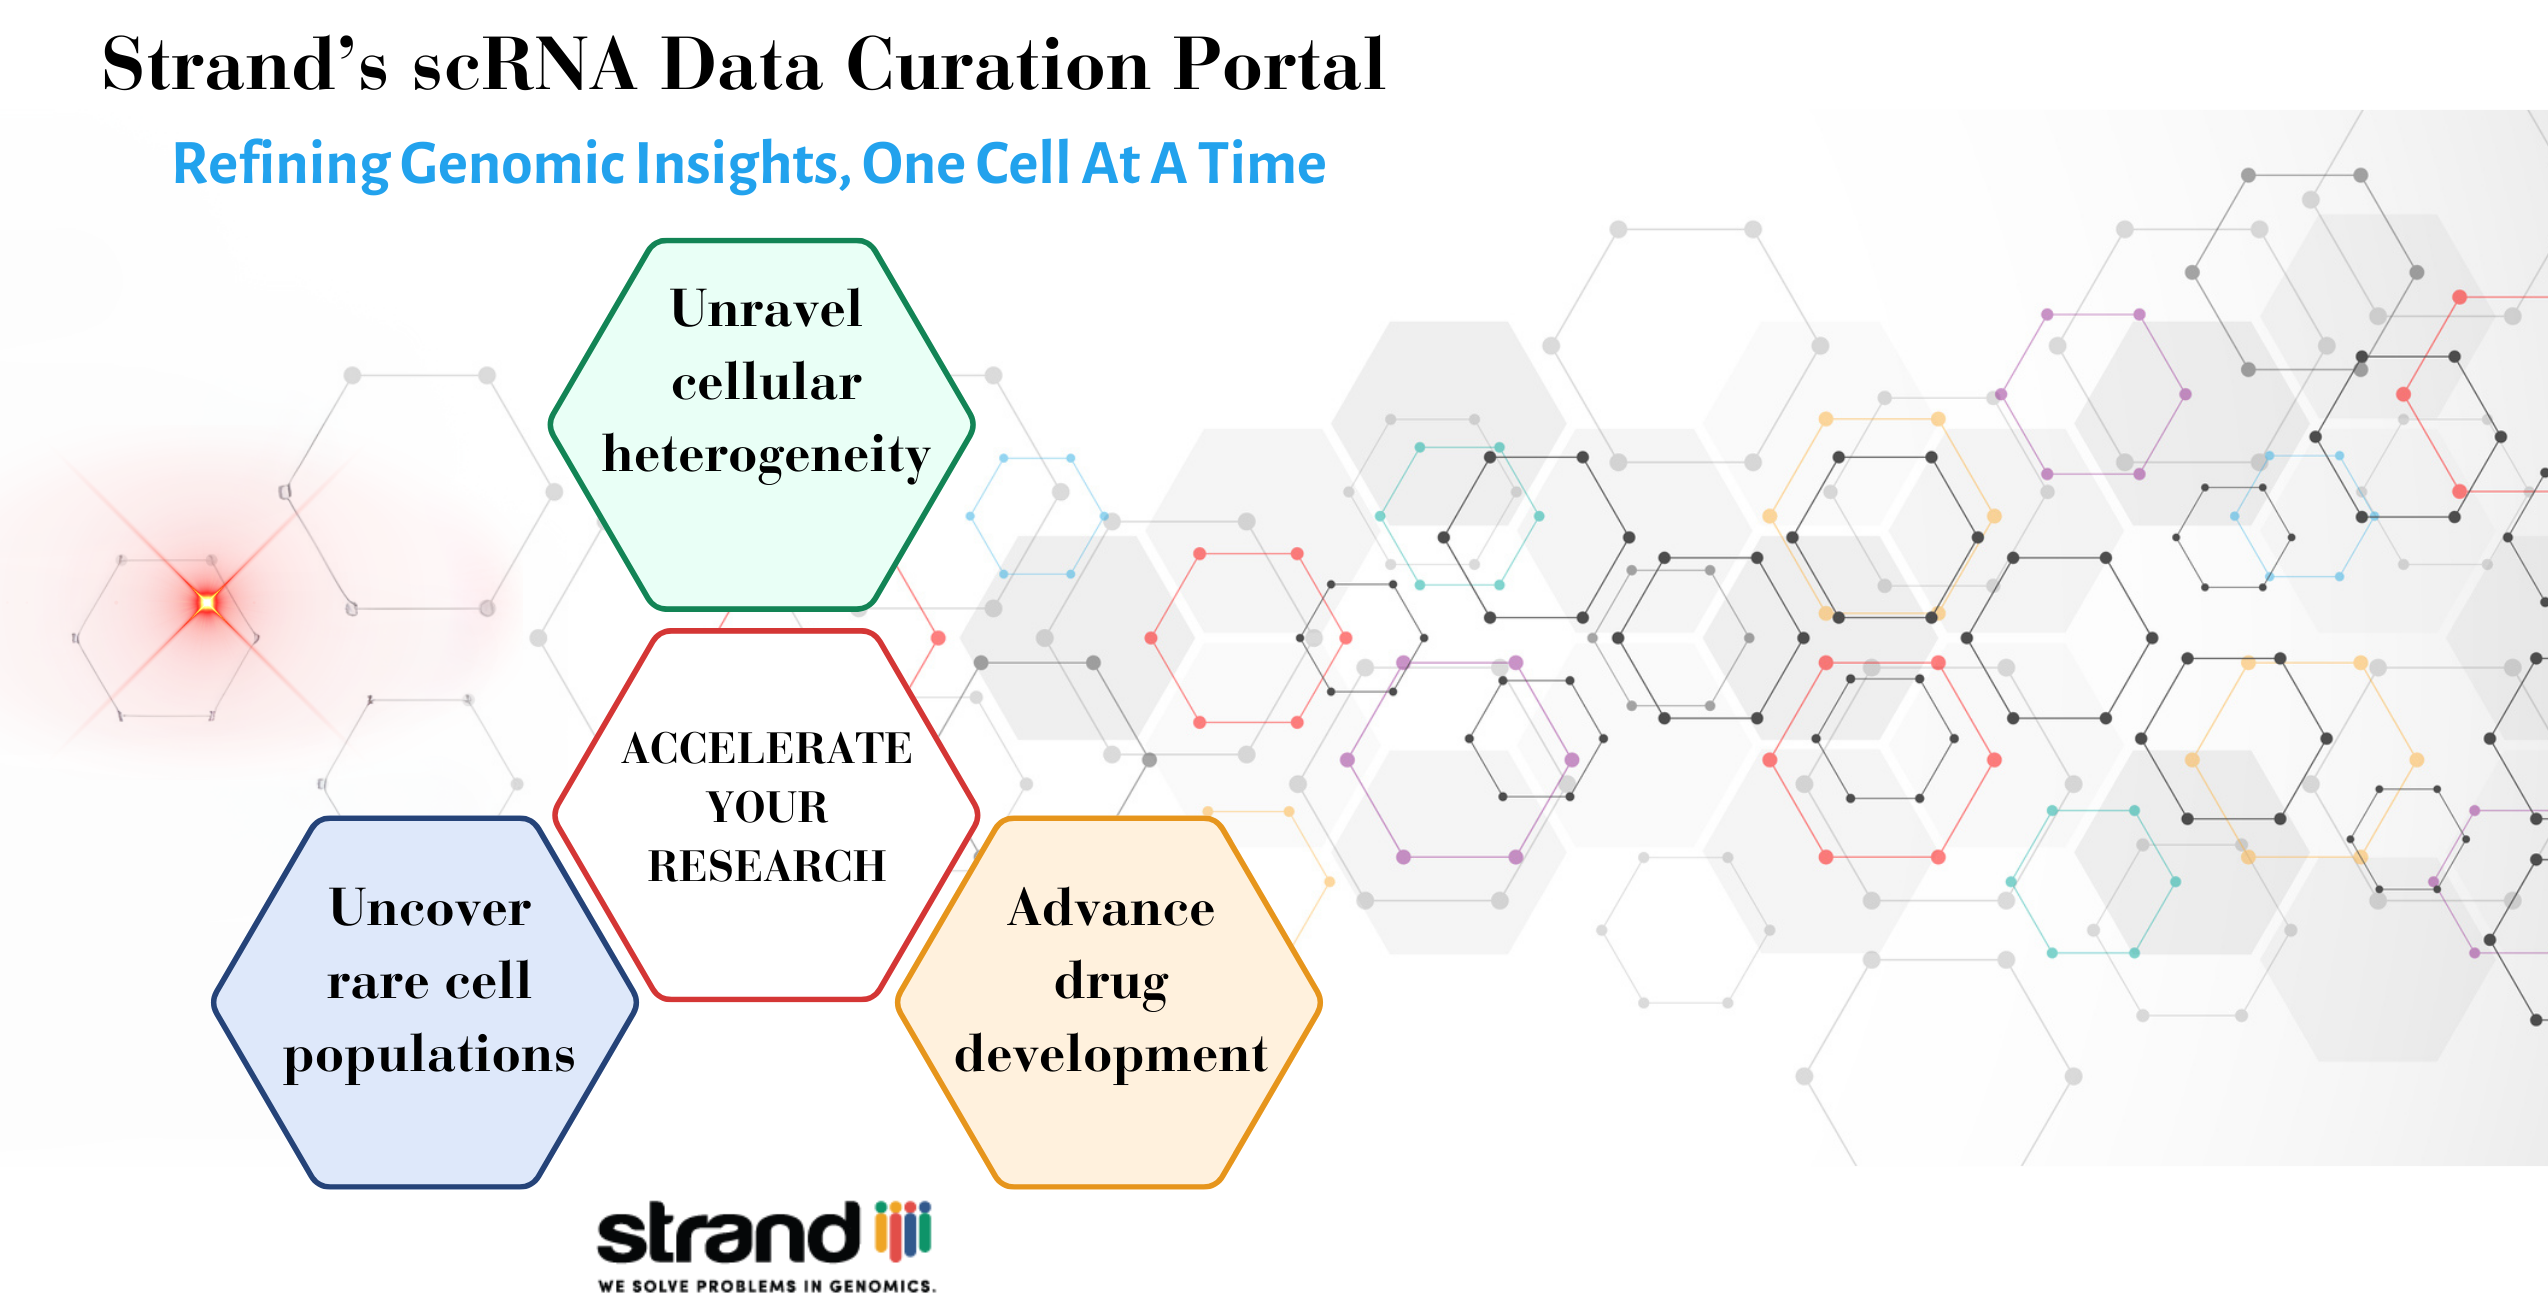
Enabling discovery of novel therapeutic targets by harnessing, organizing and harmonizing complex scRNA seq datasets
Muhammed Shifan, Sajja Vinay Kumar, Jayashri Masilamani, Tasmia Kausar, Niharika R, Atanu Pal, Ramesh Hariharan, Radhakrishna Bettadapura, Shrutee Jakhanwal
Summary
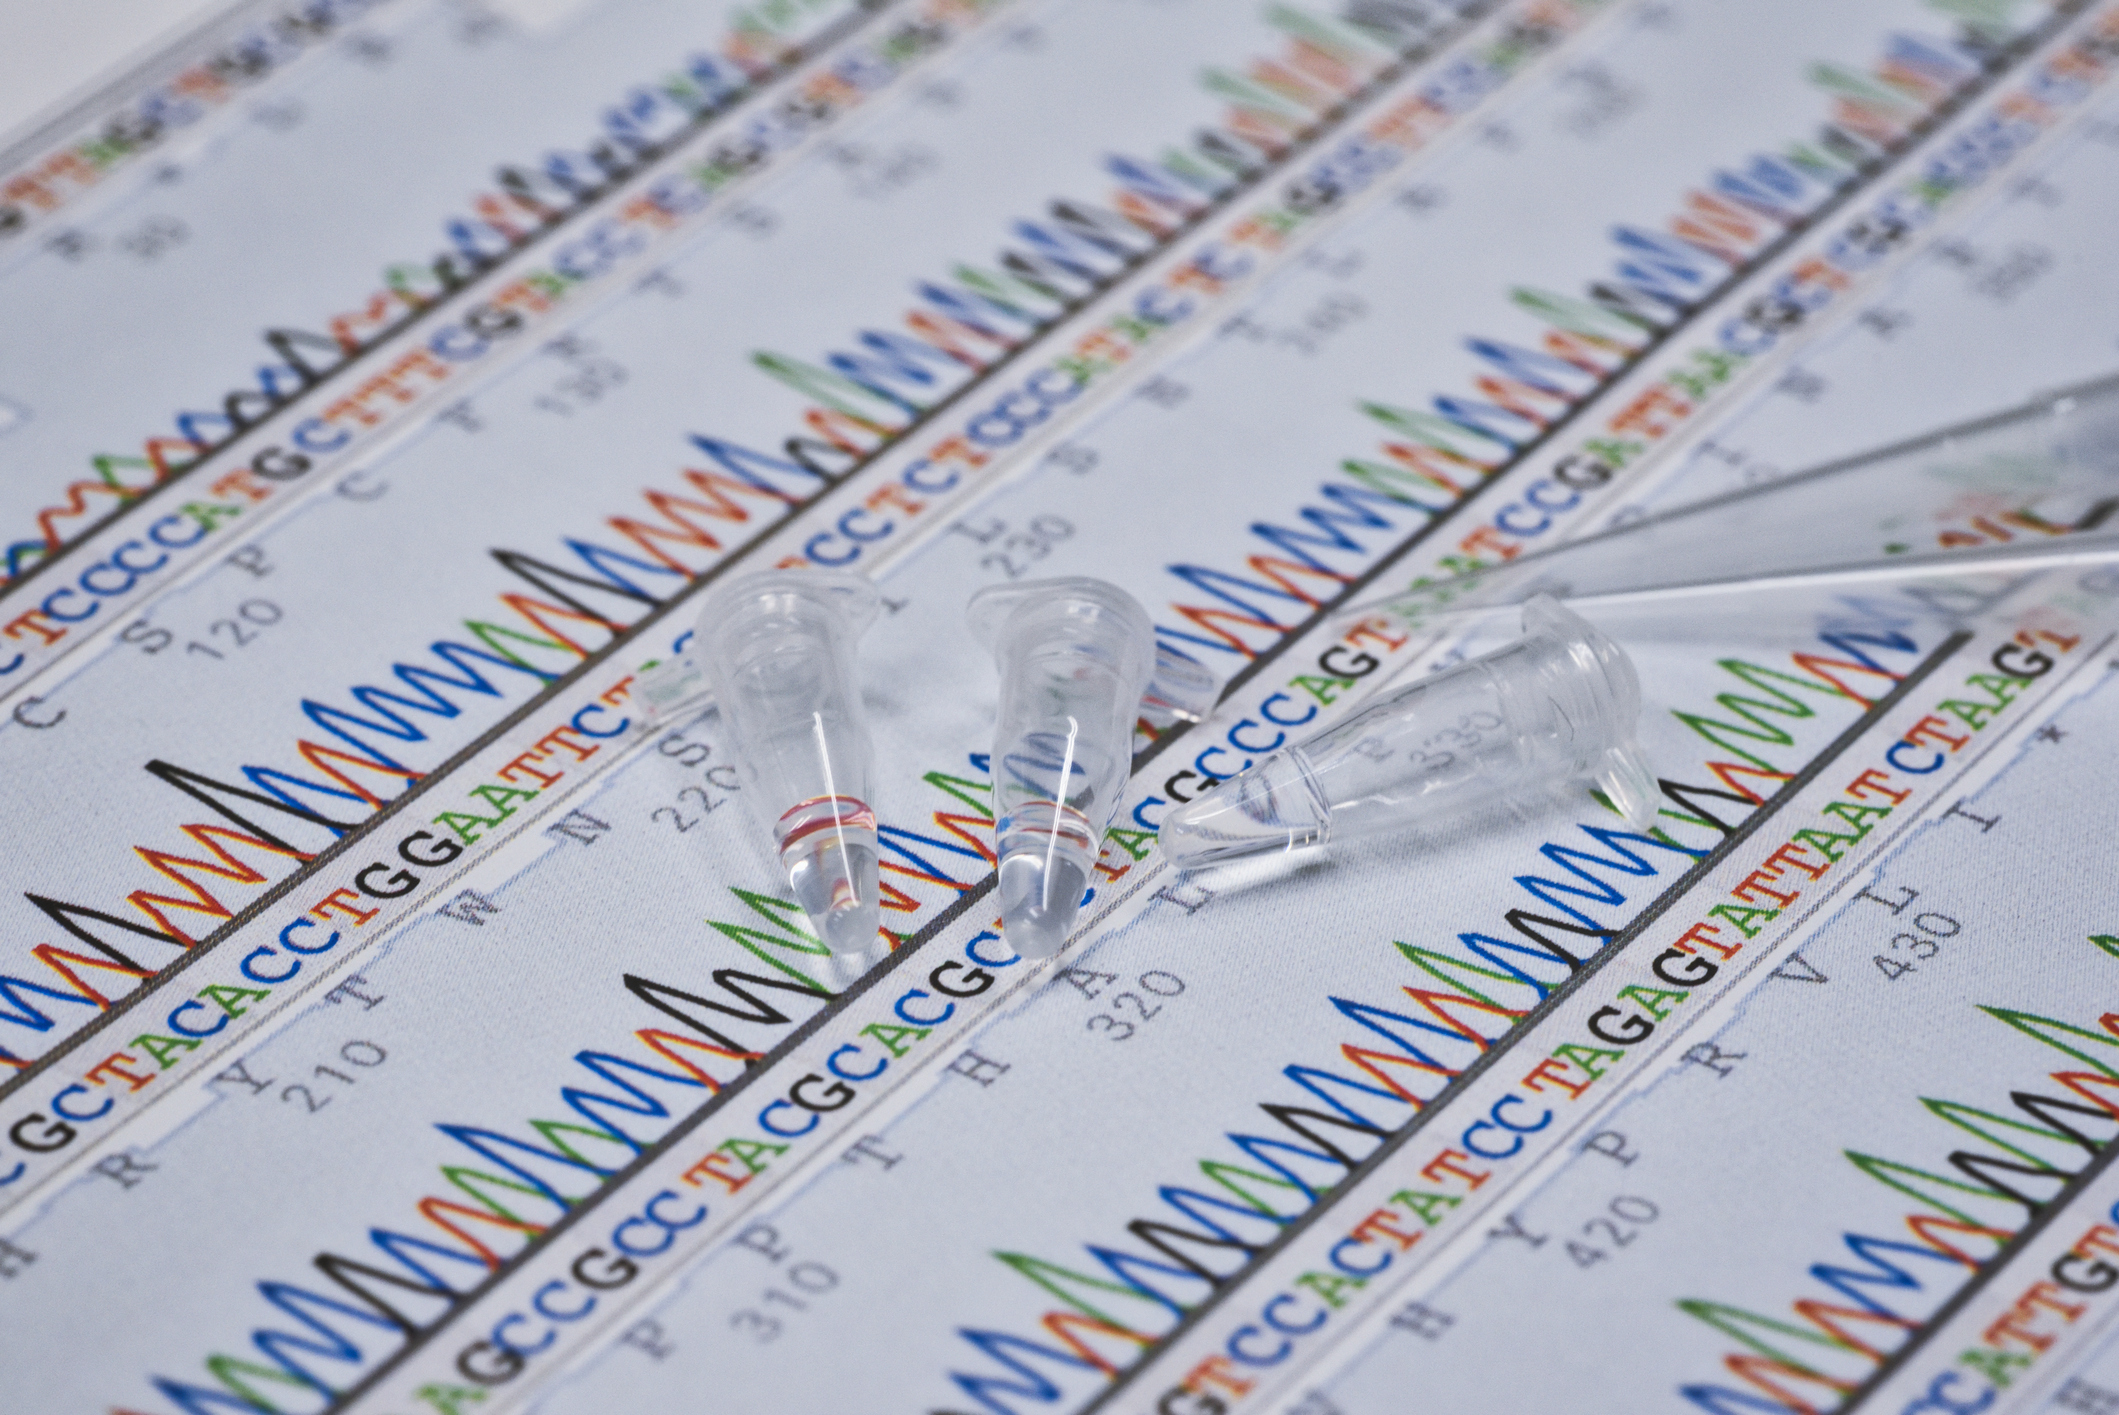
Single-cell RNA sequencing (scRNA-seq) is of paramount importance in advancing our understanding of cellular heterogeneity, which in turn, can provide unique mechanistic insights into disease pathogenesis. Since its conceptualization in 2009, the number of scRNA seq experiments have grown substantially due to increased automation, high throughput and reduced costs. With a rapid surge in such highly valuable but complex datasets, there is a necessity for approaches to harness this extensive data using defined methodologies.
Strand has developed a product service along with a data showcase for curating single-cell RNA sequencing datasets available in public repositories. We firmly believe that this effort can enable the scRNA seq community by addressing some major points listed below:
I.) Navigating complex information effortlessly through data harnessing, standardizing and filtering
- Problem statement: Research teams engaged in analyzing single-cell data for specific diseases often encounter delays lasting for days or even weeks at the outset, as they grapple with the challenge of sourcing pertinent datasets from open-source repositories.
- Solution:
- We harness scRNA seq datasets from publicly available resources, with a focus on diseases with significant unmet clinical need.
- Harnessed data is subsequently organized and harmonized using internationally recognized ontologies.
- Our data showcase currently contains (but is not limited to) scRNA seq datasets for Ulcerative Colitis (UC), deposited on NCBI’s GEO platform.
- We update our showcase monthly to incorporate any recently deposited datasets.
- Data harnessing and organization offers an integrative view of the cell-type landscape across different studies and provides effortless identification of cell types across normal and diseased states.
- By offering a robust array of 27 key filters, we enable our users to interactively navigate through various attributes, categories, and values for identifying relevant datasets in a matter of seconds.
- As we continue to expand, our data showcase will harness and harmonize datasets from other disease types with unmet clinical need, like neurodegenerative disorders, ophthalmologic disorders, etc.
- Our product service invites interested users to request data curation in their respective areas of interest.
We invite users to sign-up to our portal and use our service free of charge https://scrna-curation.mystrand.org/ .

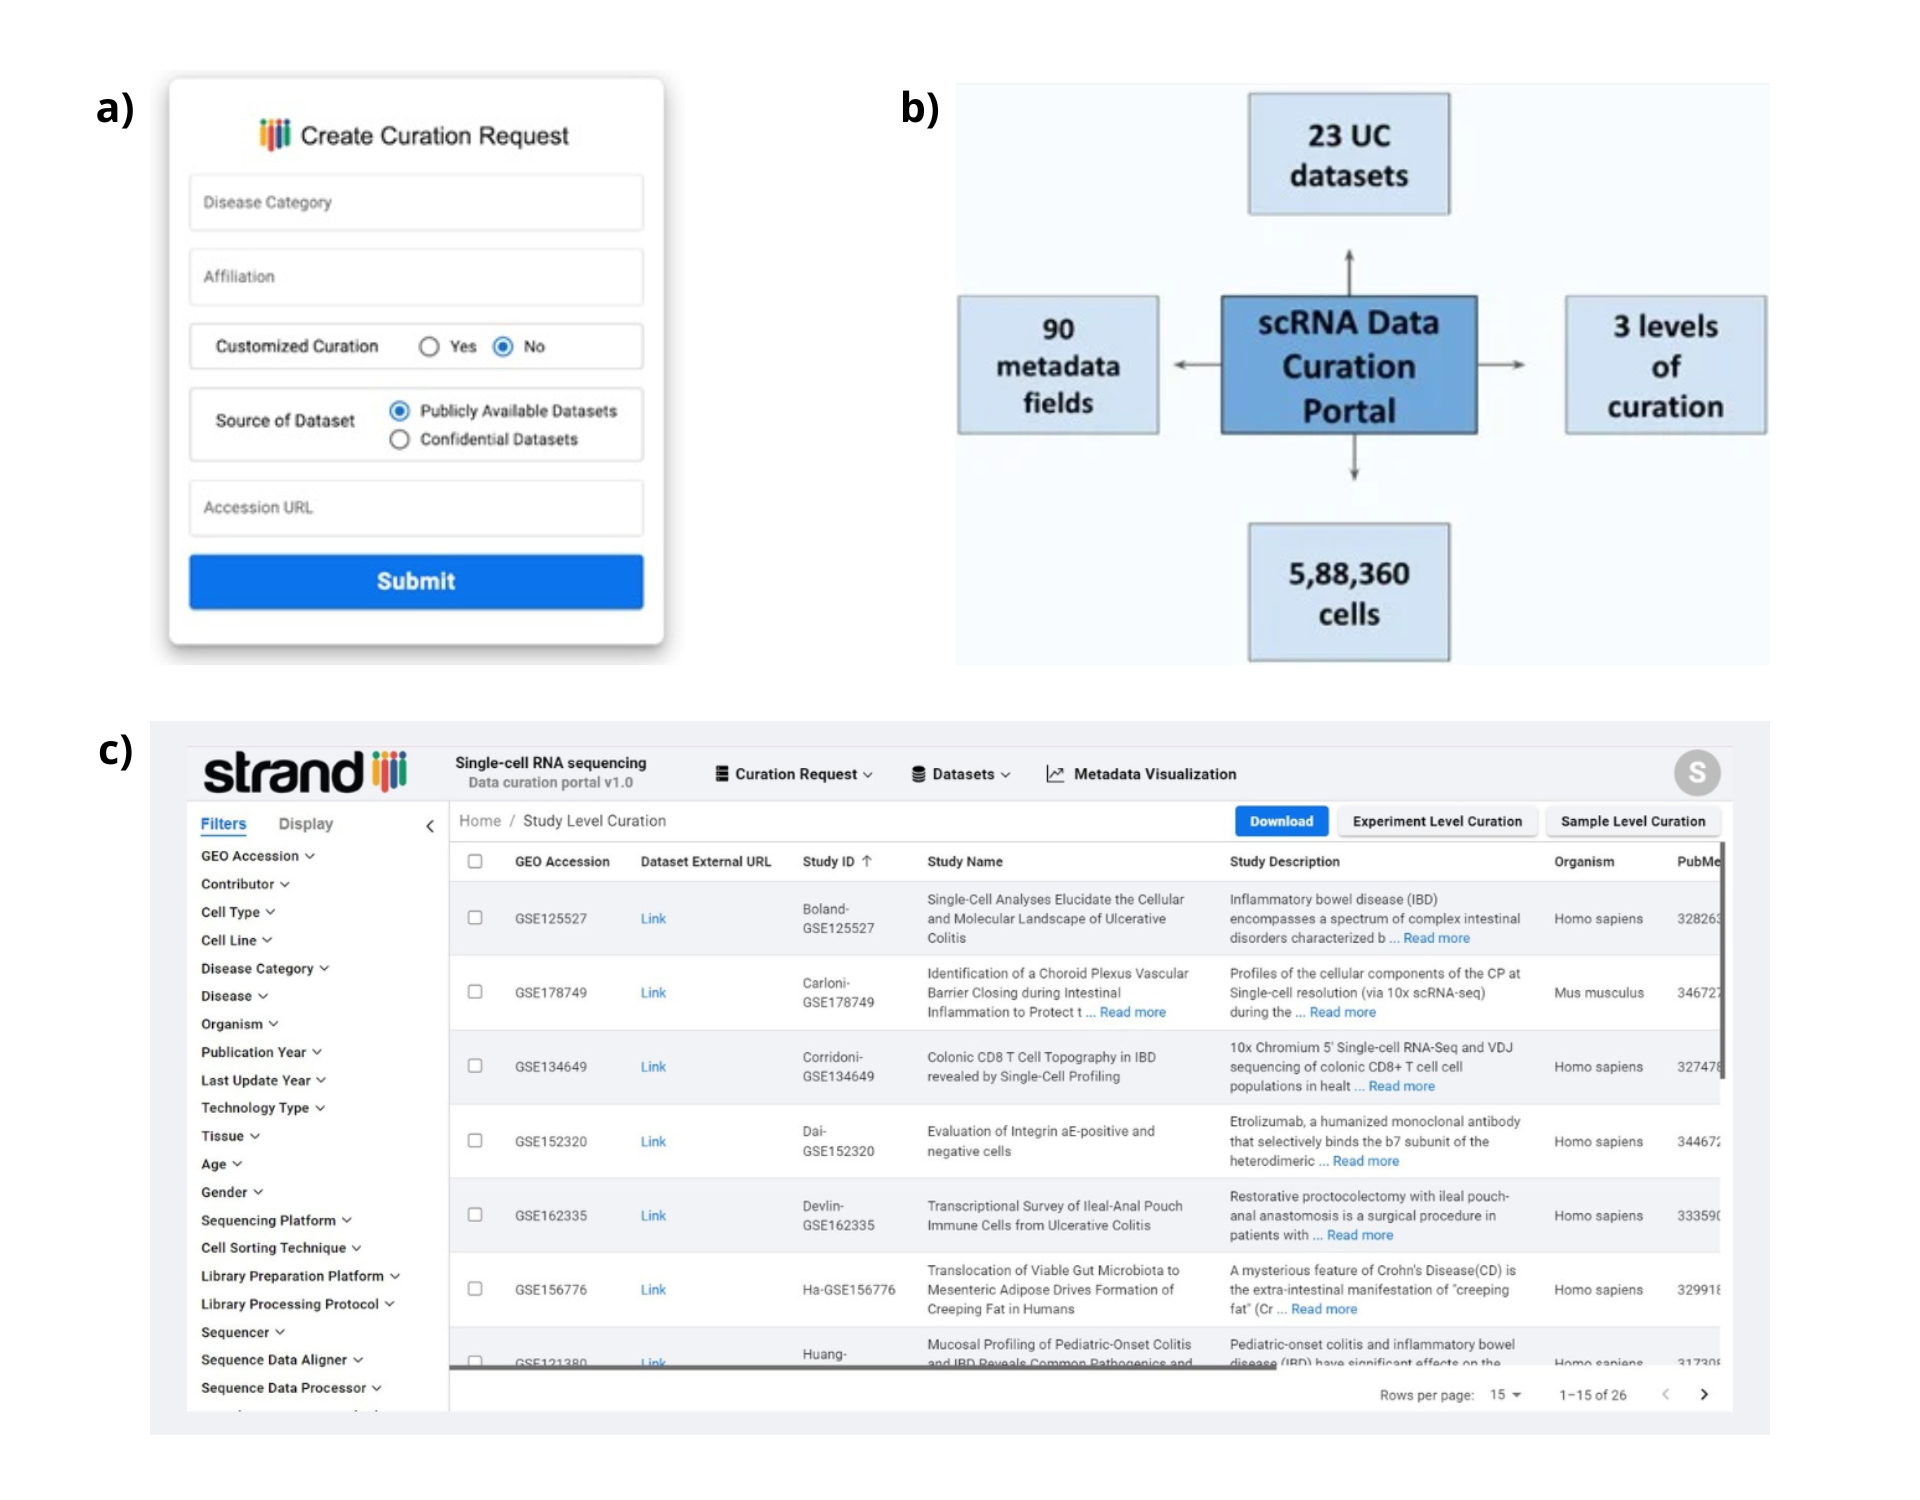
II.) Meticulous metadata curation and harmonization, with a total of 100 metadata fields across 3 levels of curation
- Problem statement: Datasets deposited in public repositories can seldom be complete, which can subsequently hinder the seamless retrieval of necessary information in a single search.
- Solution:
- We curate complex information from scRNA seq datasets at study, experiment and sample levels using 10, 42 and 48 metadata fields respectively.
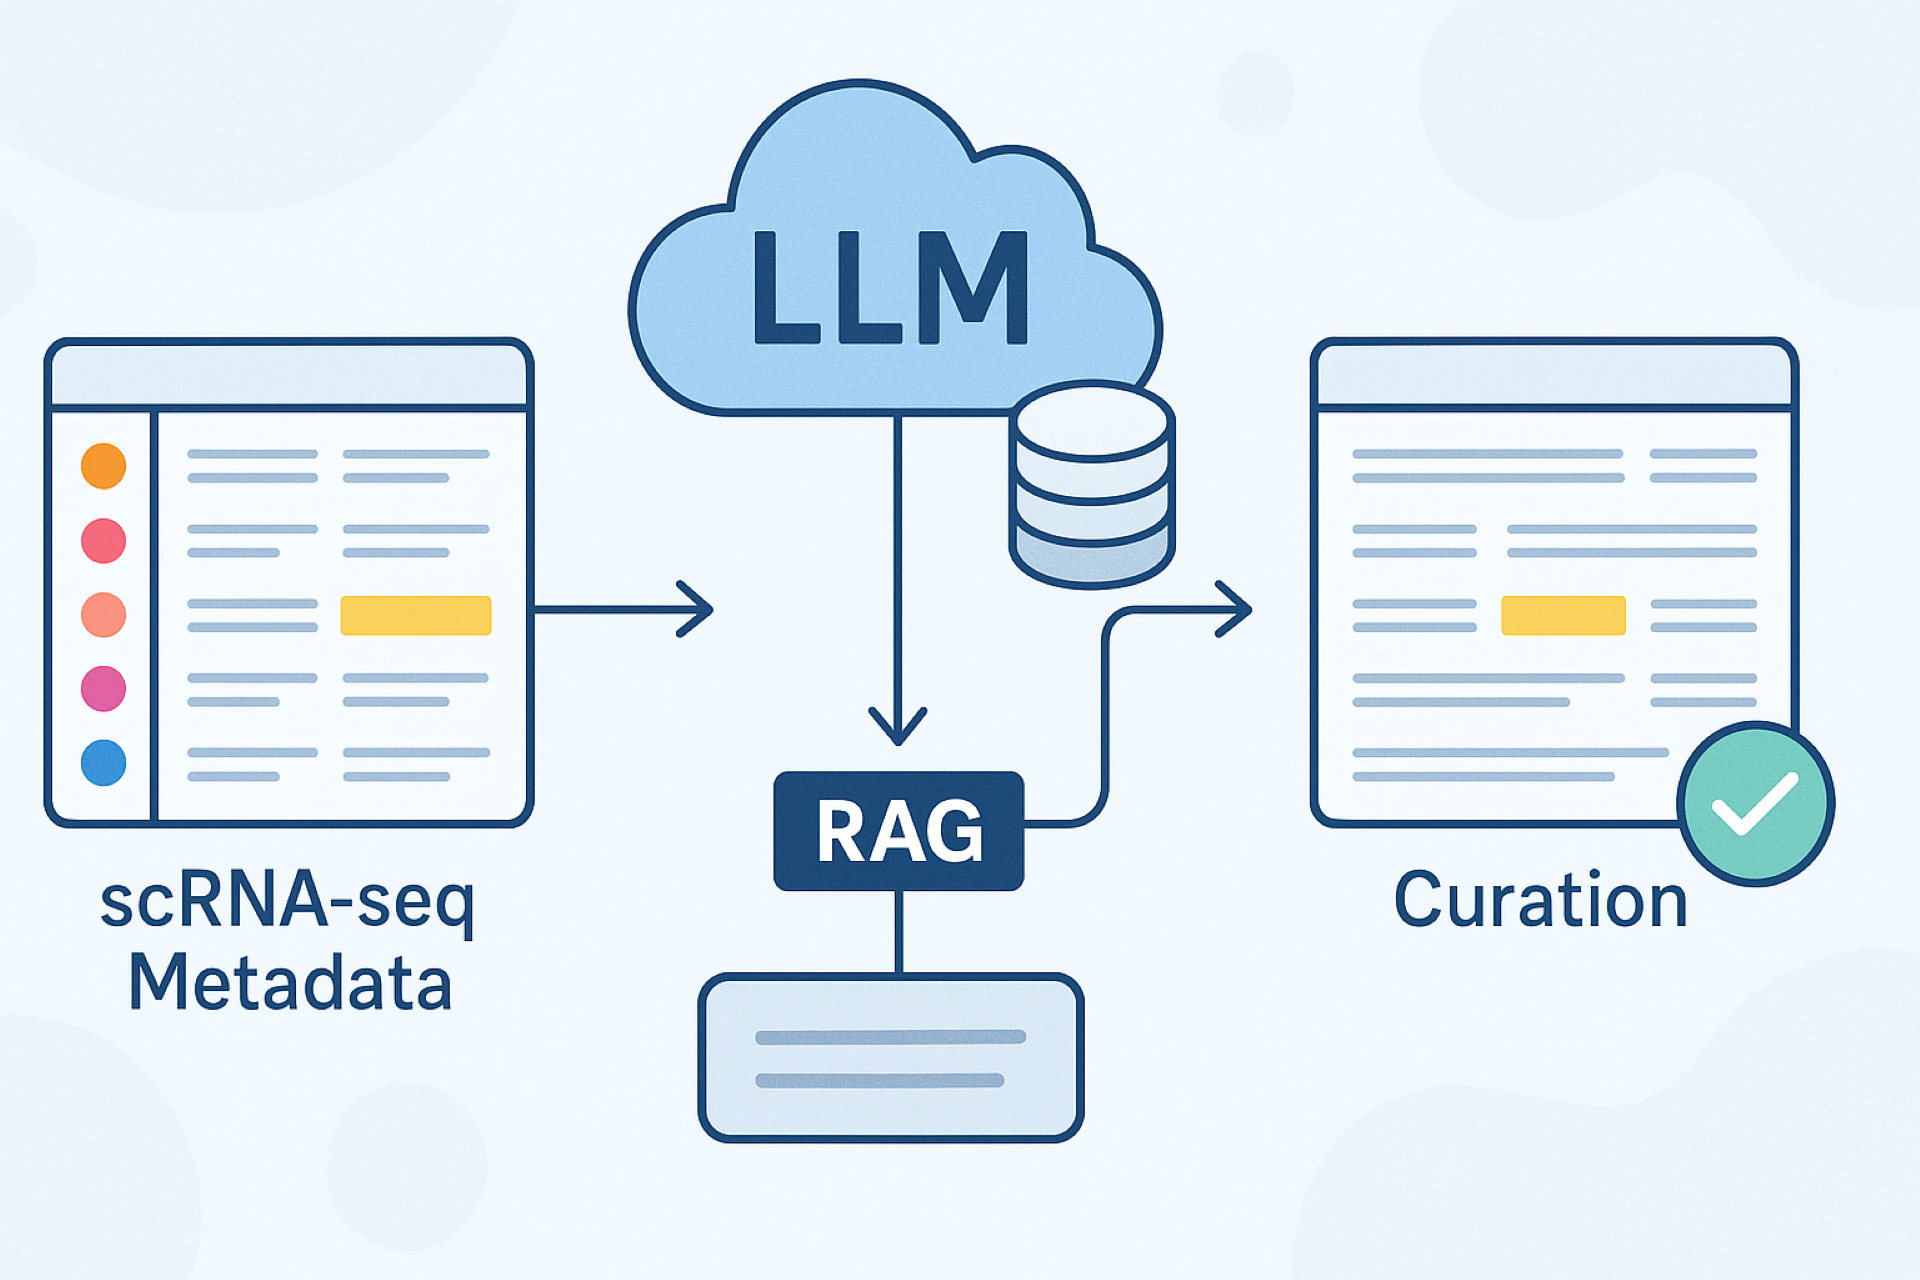
- By carefully reviewing the publication linked to the dataset, we reconstruct the metadata information that can often be missing in the deposited datasets.
- To address the lack of standardization in publicly available datasets, we perform data harmonization using internationally recognized ontologies. This, in turn, can enable seamless integration of studies from different sources to enhance the statistical significance of the reported findings and/or enable new discoveries.
- Our curation and QC processes are carried out independently in a two-step process, ensuring high quality of curated data.
- The turnaround time for each dataset is 1-2 days.
III.) Metadata visualization for curated fields
- Problem statement: Hidden patterns, correlations, and trends in metadata may not be apparent from raw data, thereby hindering effective data exploration.
- Solution:
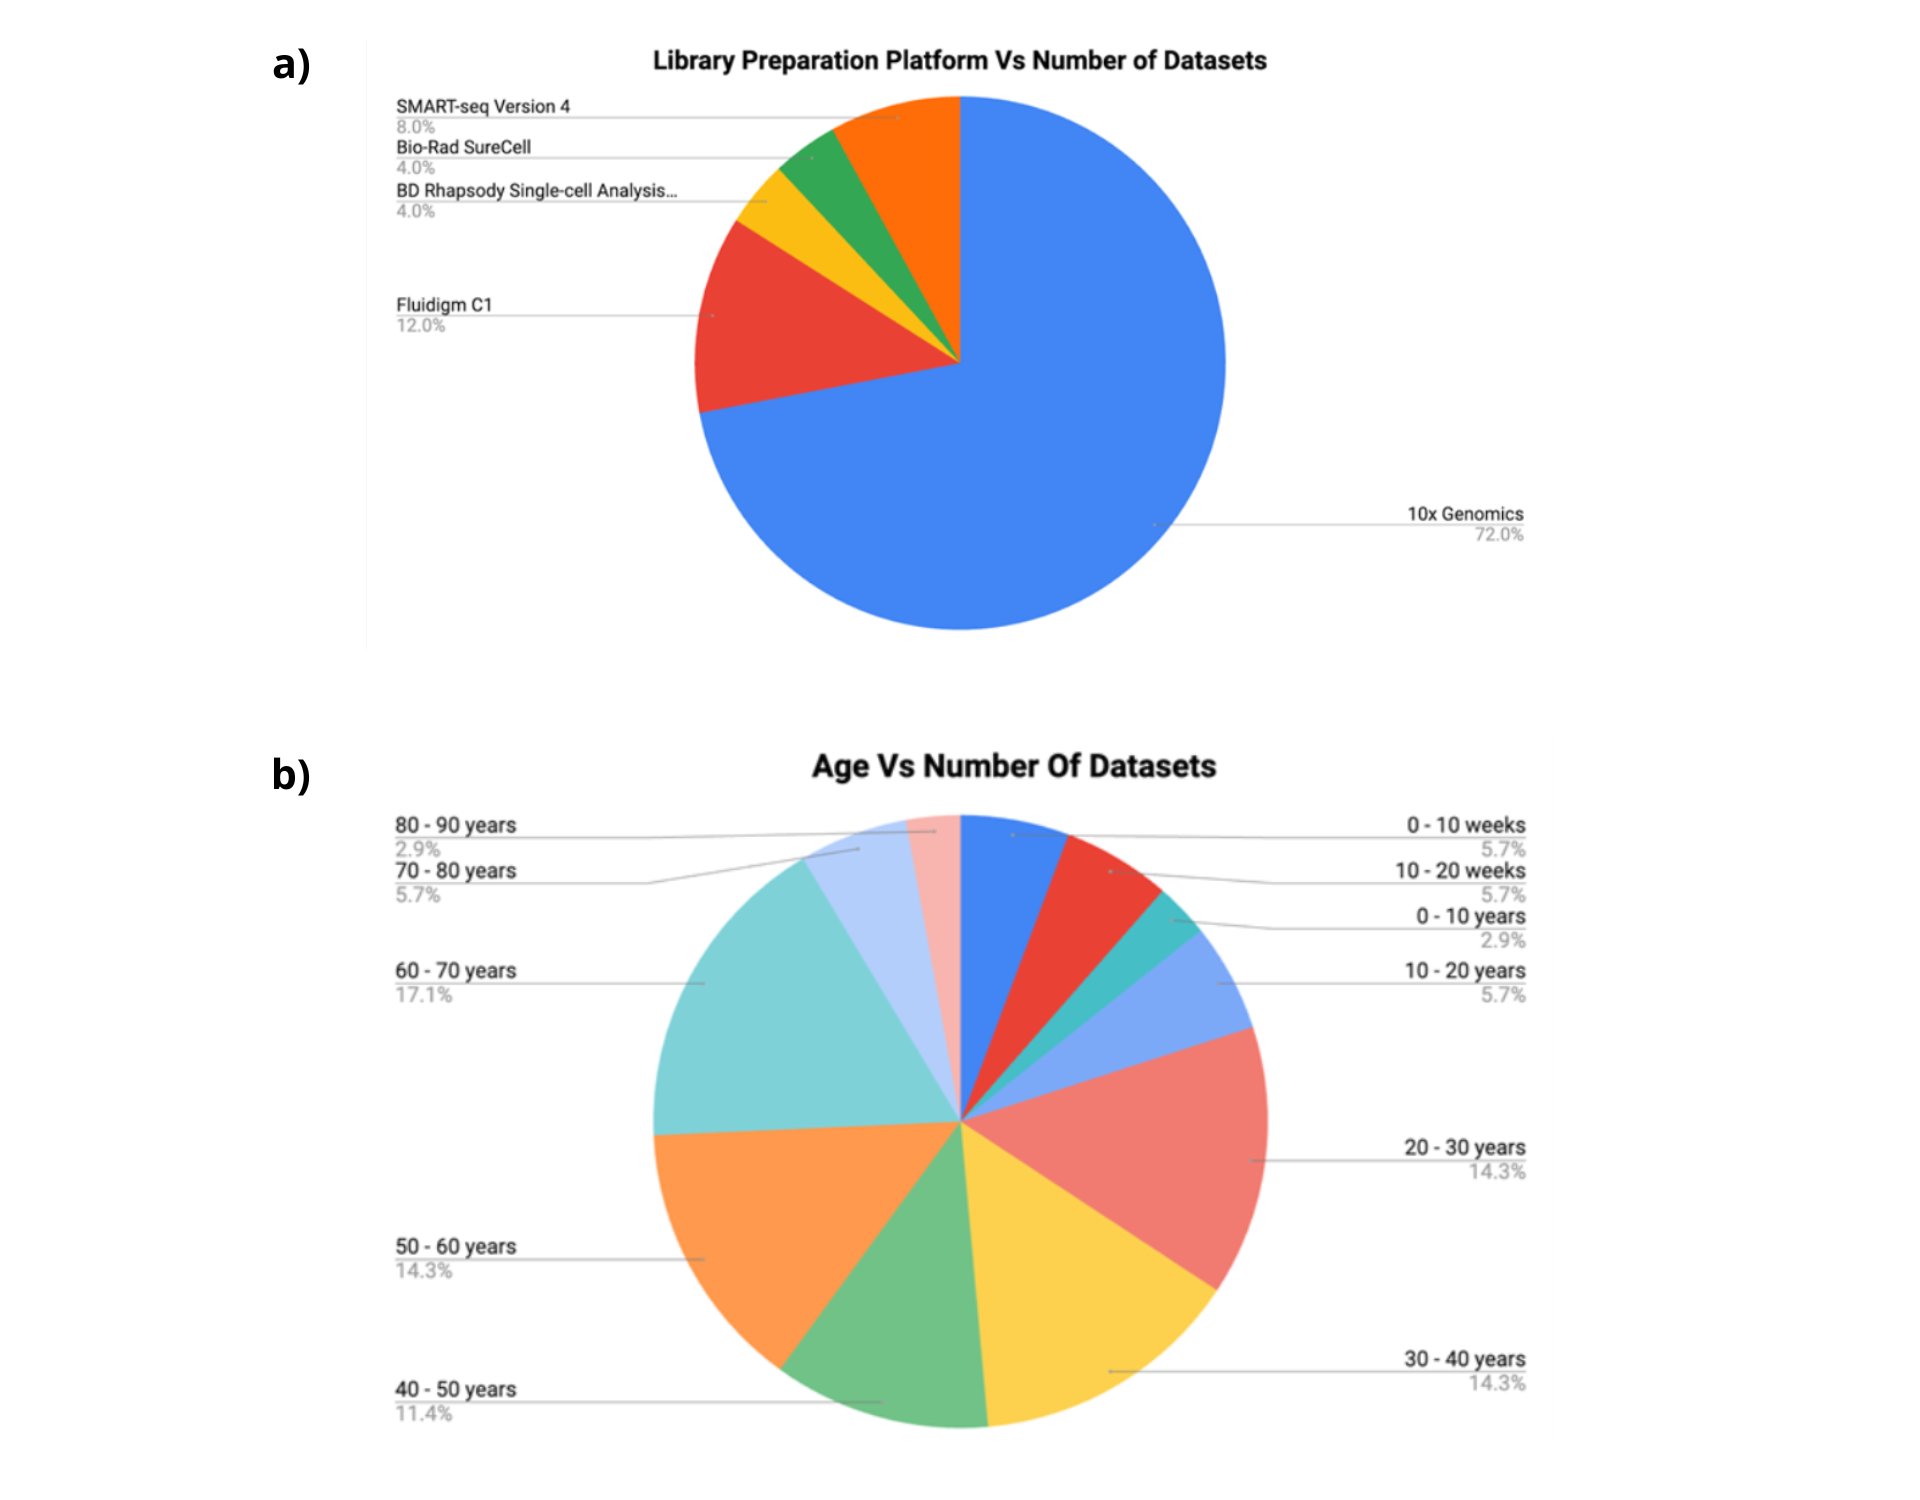
- We have plotted 23 metrics from our curated datasets in the form of bar graphs, pie charts and line graphs.
- By visualizing metadata attributes across different studies, users can identify recurring patterns, interesting subsets, outliers, or anomalies within the metadata, leading to deeper insights.
- We enable export of our visualizations and allow users to effectively communicate key findings, trends, and recommendations in a compelling and accessible manner.

Key Insights:
Ulcerative Colitis is a chronic inflammatory disease with no available treatments for cure. Studies utilizing single-cell RNA sequencing (scRNA-seq) technology have unveiled cellular subpopulations implicated in UC pathogenesis, providing fresh perspectives on the pathways linking the genome to disease. Our data showcase currently hosts ~500k cells from 26 curated datasets sourced from NCBI’s GEO platform. Here are a few insights that we could derive from our data showcase:
- Mean cells per GSE ID is ≈30k cells, with 46 different cell types for 26 different studies.
- Mean number of cell types <=8, suggesting that these experiments are being used to determine the expression patterns of a specific small number of cell types in the disease vs healthy condition.
- Studies showed a total of 16 tissue types and 13 pertain specifically to the intestine and rectum; the odd ones out are PBMCs, blood and choroid plexus.
- The major age distribution was in the range of 20-40 years and 50-70 years, consistent with reports in literature.
- More than 30 major cell types appear to be associated with the inflamed disease status of intestines in Ulcerative Colitis. Exploration of expression levels and pathways can help us further pinpoint the role of these cells in disease pathogenesis for enabling potential discovery of therapeutic targets.

Let's Connect
Let's Connect

download the case study.