


Blogs
Enhancing Cancer Drug Discovery with Mass Spectrometry-based Metabolomics Analysis
Metabolomics is the comprehensive study of the metabolites - small molecules that are products of metabolic reactions within a biological system. This analytical approach, integrating biochemistry, bioinformatics, and clinical research, can be used to detect metabolites in tissue samples, measure their concentrations, track altered metabolic pathways, and develop biomarkers for diseases like cancer.
The rapid growth of cancer cells is supported by metabolic changes, which create distinct features that can be used for early diagnosis, treatment selection, and monitoring. These changes, like increased glucose and glutamine uptake, or altered TCA cycle enzymes, expose vulnerabilities that precision medicine can target, e.g. Bladder cancer shows altered TCA cycle metabolites, and colorectal cancer displays disrupted methionine metabolism, offering opportunities for targeted therapies that exploit these metabolic dependencies.
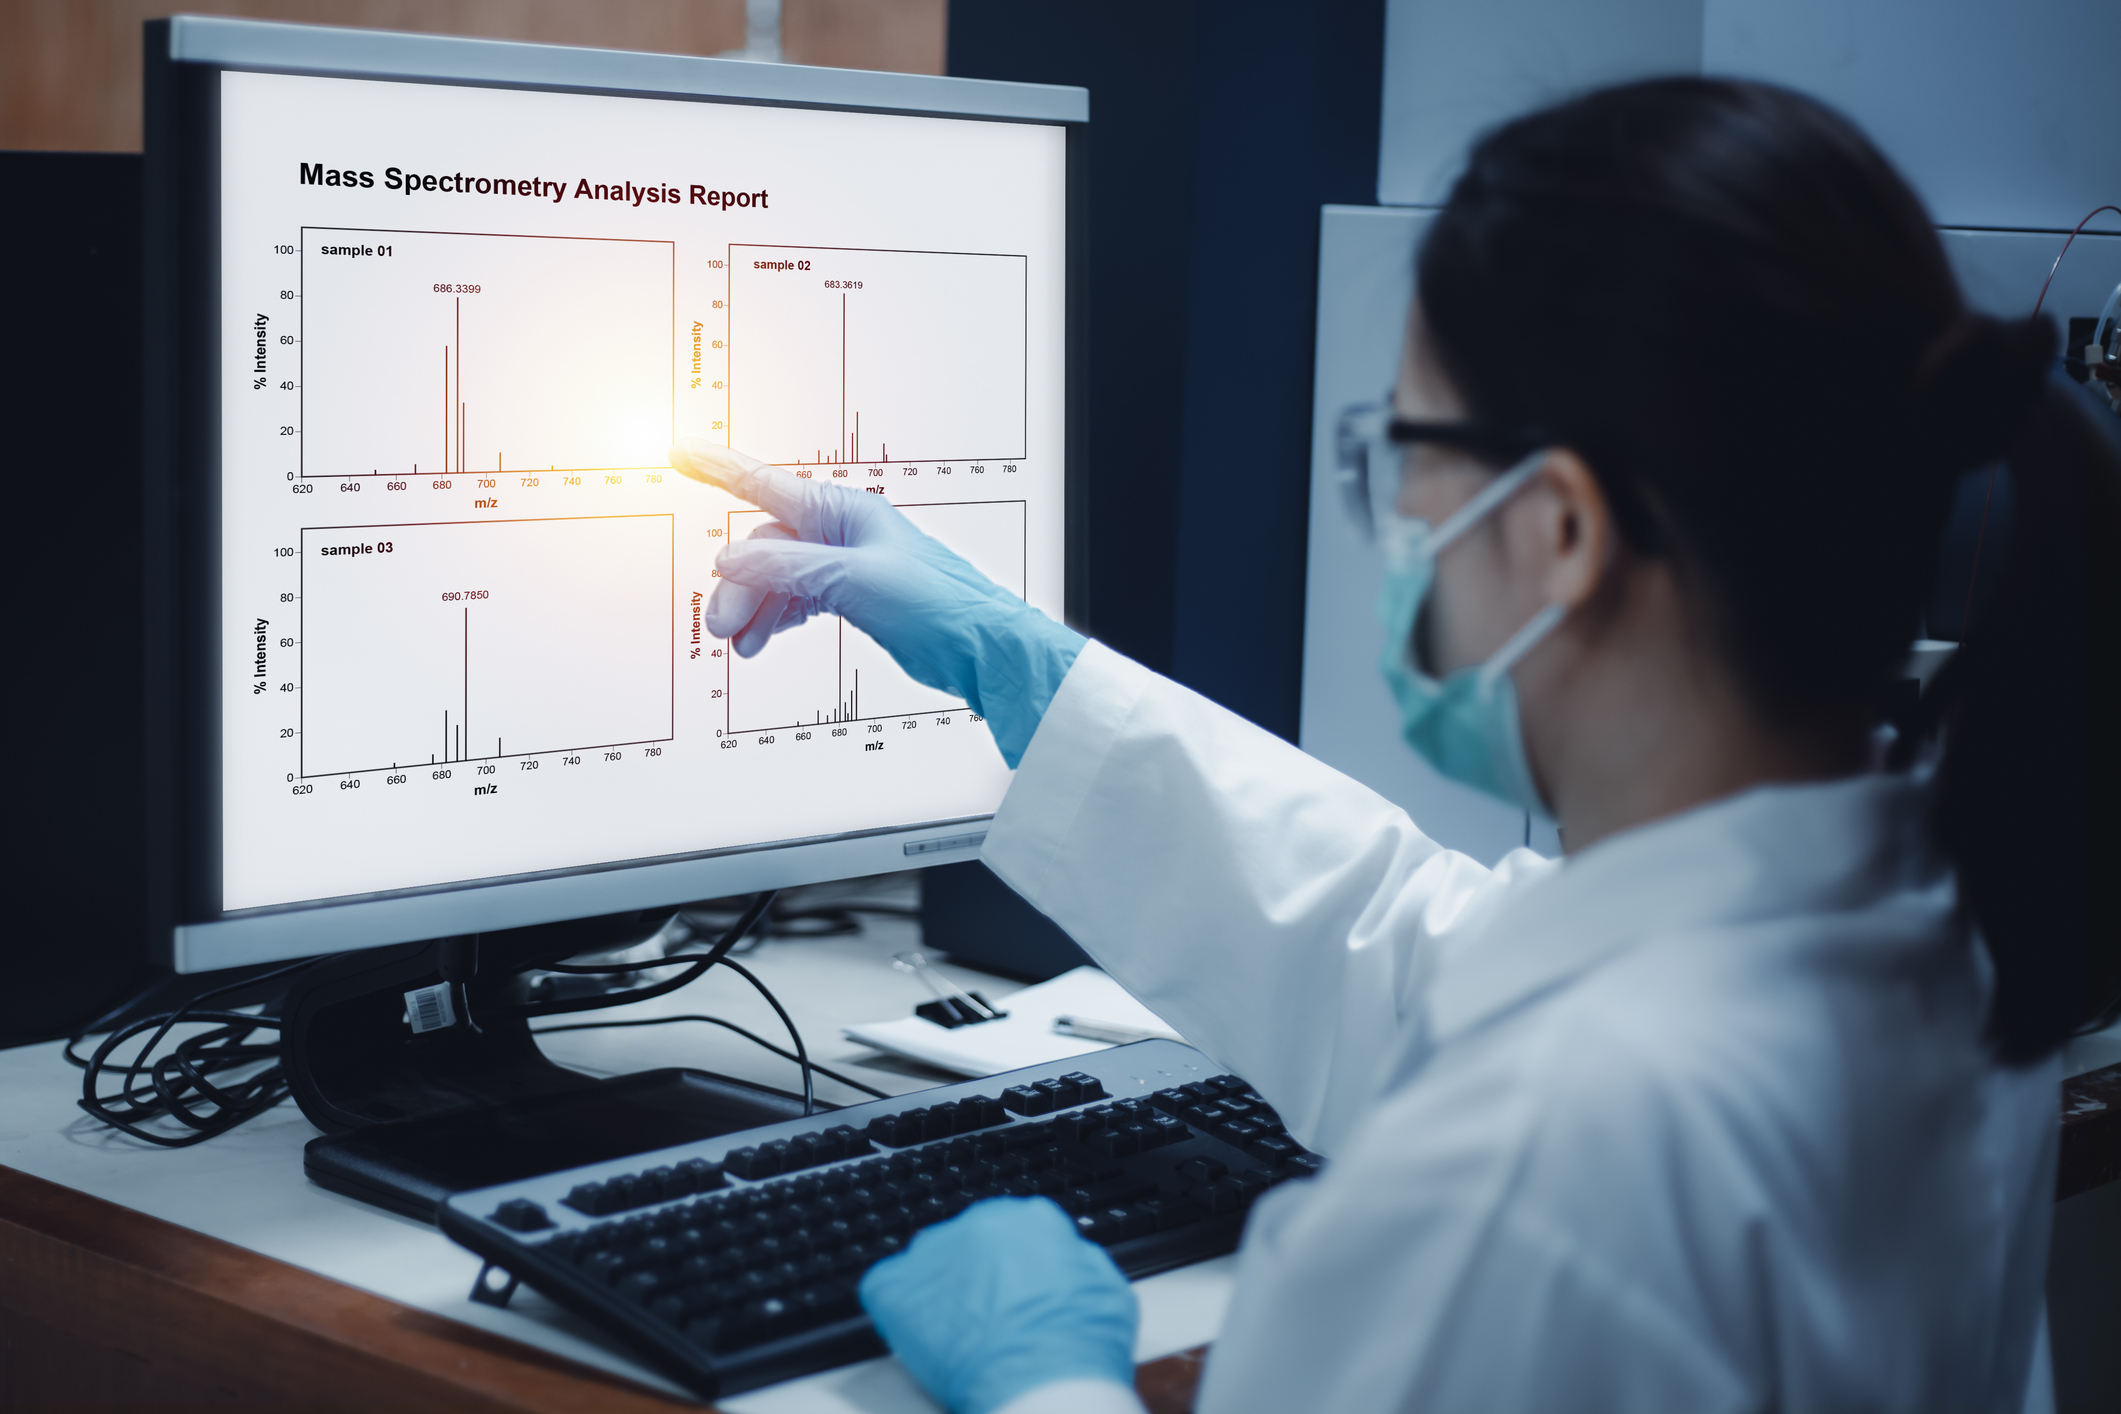
There are two main platforms of metabolomics analysis: mass spectrometry (MS) and nuclear magnetic resonance (NMR) spectroscopy. Out of the two, MS-based metabolomics provides high sensitivity and selectivity and thus is the most widely used for research. However, even a single MS experiment can generate gigabytes of complex data. The unique nature of metabolomics data necessitates the use of specialized bioinformatics tools within a defined workflow.
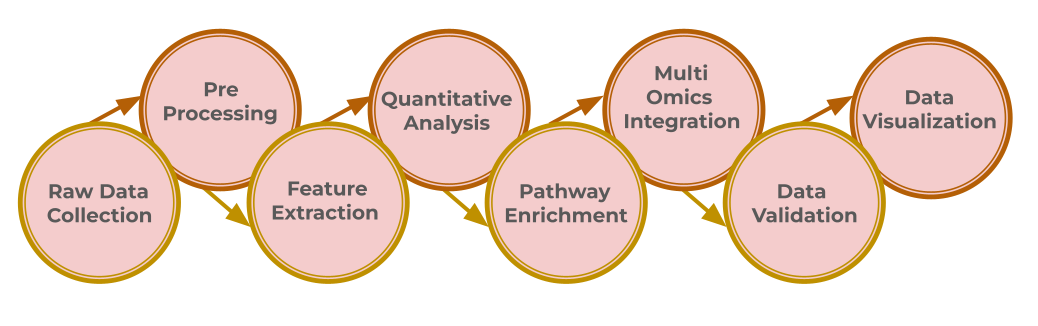
The very first phase of metabolomics data analysis involves collecting raw data using methods like liquid or gas chromatography-mass spectrometry (LC/MS and GC/MS). These methods produce extensive datasets such as mass spectra and retention times, which reflect the molecular signatures of metabolites in the sample.
Prior to analysis, the raw data must be preprocessed to ensure it is clean and ready for interpretation. The preprocessing steps include peak detection, noise reduction, baseline correction, retention time alignments across samples, data normalization and transformation. Quality control samples are used to filter out low-quality data and correct for biases. This is a critical stage in untargeted metabolomics studies. Each step of the data preparation workflow, from the raw data to a table of metabolic features, must follow clear and reproducible procedures to ensure the generation of high-quality datasets.
After that, the crucial step is feature extraction, i.e. identifying metabolites from the detected peaks by comparing their mass-to-charge (m/z) ratios, fragmentation patterns, and retention times with reference databases. Accurate identification is crucial for understanding the biological relevance of the compounds.Reference libraries like KEGG, specialized databases, and predictive computational tools are utilized to do this accurately.
Post identifying, quantitative analysis is done to determine metabolite concentrations in different samples, in order to figure out which metabolic pathways may have been altered. Bioinformatics tools like Skyline and Metabo Analyst help to process quantitative data, and identify differentially expressed metabolites between cancerous and non-cancerous conditions.
The next step involves enrichment and pathway analyses to connect screened metabolites with relevant pathways or disease conditions. This step requires advanced tools and databases to perform network analyses, identify overrepresented metabolic pathways among altered metabolites, link metabolomics data with gene and protein expression, and pinpoint key regulatory hubs that could be targeted for cancer therapy.
Then, multi-omics integration is used to contextualize this metabolomics information by integrating it with genomics, transcriptomics, and proteomics. This can reveal how genetic mutations, transcriptional shifts, & enzyme protein modifications can influence cancer metabolism. Merging different omics layers presents complex processing challenges, and requires specialized platforms.
Finally, the data is validated and interpreted. Metabolomics data analysis employs both univariate statistical methods (e.g., t-tests, ANOVA) for initial screening and multivariate techniques (e.g., PCA, PLS-DA, RF, SVM) for exploring complex patterns and variable selection. with machine learning techniques like SVM and random forests predict drug responses, identify biomarkers, and classify cancer subtypes by analyzing metabolic profiles.
Each step of the workflow is sensitive, and requires sophisticated, high throughput data analysis capacities. The Mass Profiler Professional (MPP) developed by Strand for Agilent technologies is a chemometrics software that can not only handle a variety of MS based analyses, but also provide advanced tools for identification, statistics, data visualization and pathway analysis for metabolomics and proteomics studies, with a smooth and flexible user interface.
The MPP optimizes every step of this workflow. starting from convenient import of large sample data sets, differential analysis of multiple sample sets from different MS analysis platforms, compound identification from different types of mass spectra, tools for univariate/multivariate statistics, pattern recognition, & class prediction, to joint analysis of multiple omics datasets (Pathway architect). The user interface allows both predefined settings for new users, and customizable parameters for more advanced ones - with the ability to automate each step. It also features the MassHunter Classifier tool, which automates sample classification and revolutionizes the analysis of unknown samples in mass spectrometry.
Thus, the MPP offers an integrated solution for the analysis, comparison, visualization, and classification of data groups while being compatible with other Agilent software, such as the Agilent MassHunter suite.
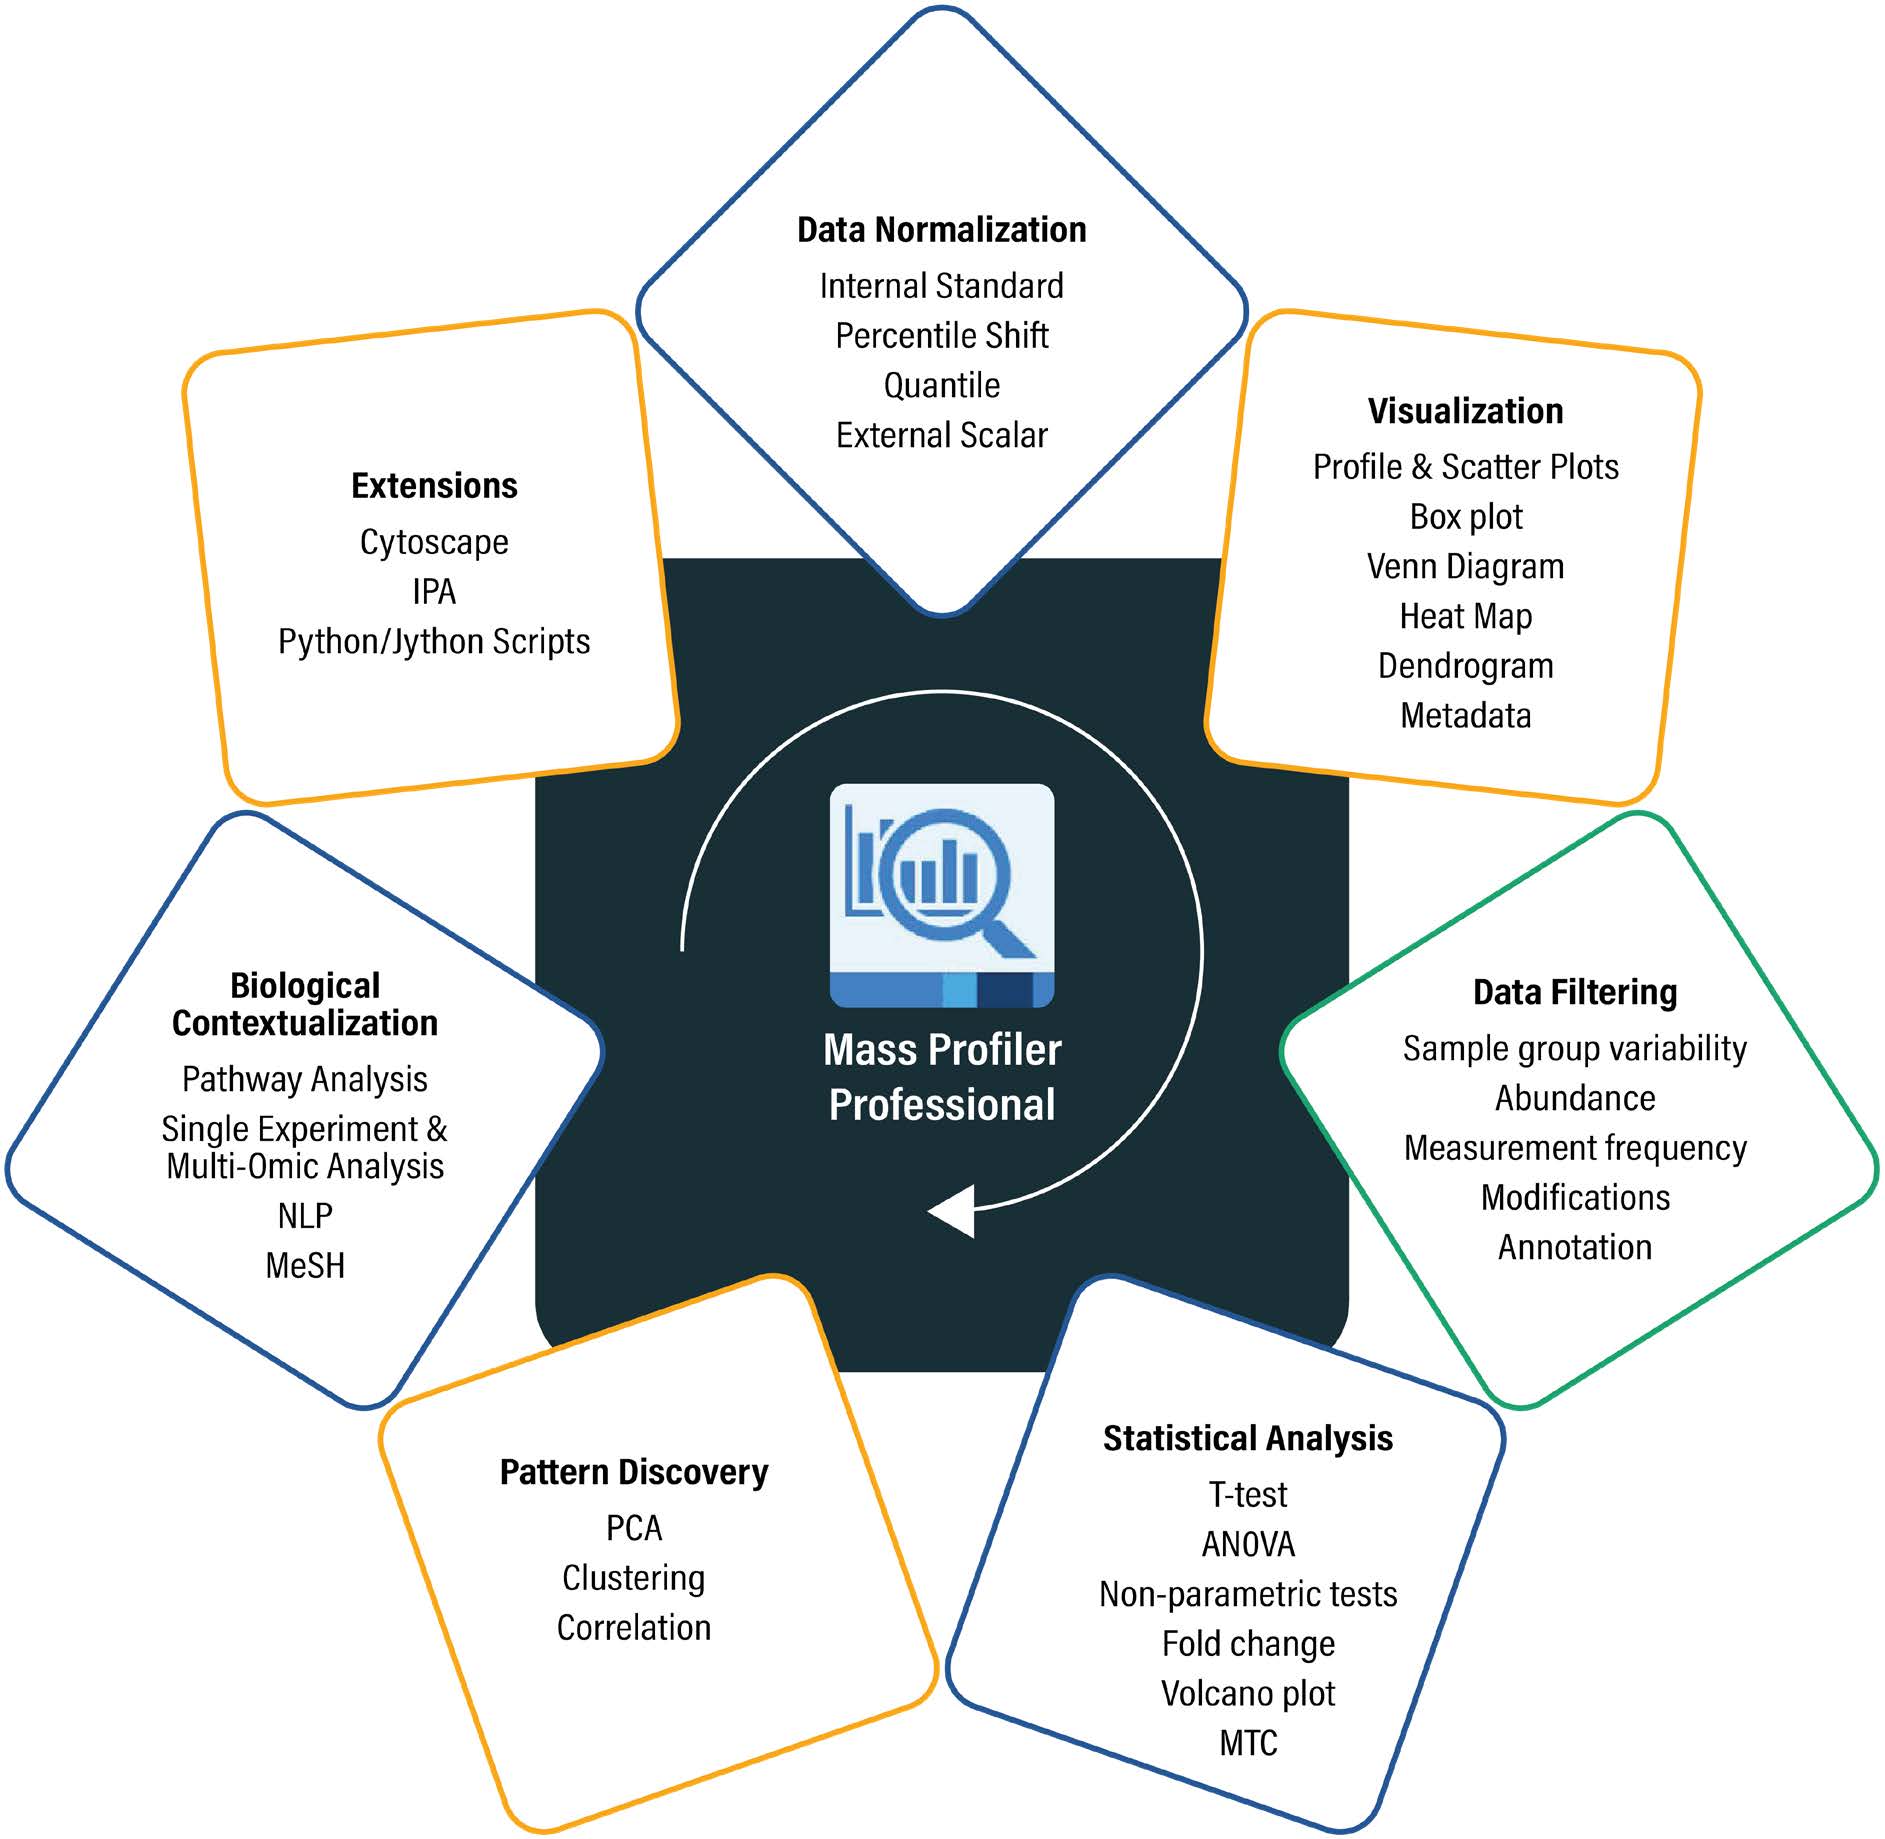
Figure 2: The various features of MPP, including data normalization, visualization, data filtering, statistical analysis, pattern discovery, biological contextualization, and extensions, are represented. Strand has implemented and tested algorithms and visualizations in both Java and C# .NET for the metabolomics, proteomics, food, and environmental markets.
Strand also offers technical support and maintenance for the MPP, ensuring a seamless user experience. The MPP has been cited over 2000 times in Scholar, highlighting our dedication to enabling cutting edge research and development in metabolomics. To know more, read this case study.
Precision Medicine
11 Sep 2025
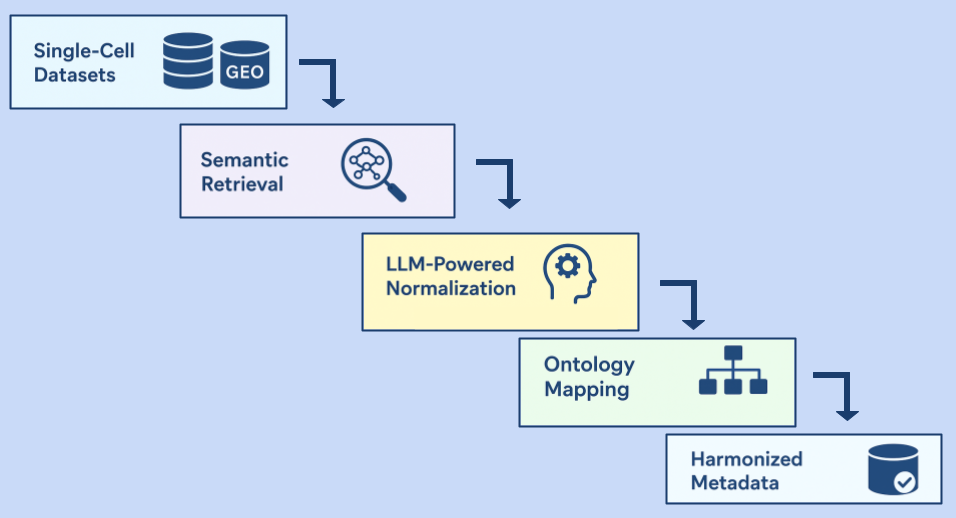
Accelerating Single-Cell Metadata Normalization and Harmonization through Strand's RAG+LLM Pipeline

FDA Rule on Lab Developed Tests (LDTs)
13 Sep 2024
Partnering with New Molecular LDTs: Strand's FDA Compliance Roadmap

Strand’s Methylation Pipeline Series
24 Jan 2025
Strand’s Methylation Pipeline - An Overview - Part 2
Let's Connect
Let's Connect

download the case study.