


Blogs
How Strand is Connecting the Dots Across Individual Clinical Journeys
Understanding an individuals’ clinical history and the reasons why they switch treatments can offer valuable insights to guide clinical decisions and improve outcomes. But bringing together diagnoses, treatment records, lab results, and reports is often difficult and time-consuming because these datasets are stored in different formats/systems.
For pharma teams working on complex conditions like IBD or neurodegenerative disorders, this challenge is all too familiar, with individuals’ journeys being long and fragmented across multiple data sources. And so, without a comprehensive view, it’s difficult to see how these different factors influence outcomes and identify actionable patterns at scale.
At Strand, we’ve developed a Clinical Journey Visualization Tool to help pharma teams tackle this challenge by mapping and customizing complete participant journeys using UK Biobank data.
- The portal first harmonizes the data by standardizing and aligning information such as diagnoses, prescriptions, lab results, and procedures into a common, comparable structure. Here, raw data with mixed categorical and numeric fields are processed into mapped, readable formats with standardized units and codes.
- The harmonized data is then fed into an interactive dashboard with an integrated timeline that tracks each journey from diagnosis to treatment switches, making complex data clear and connected.
Use Case
- The portal is primarily used for quality control & cohort management, and mapping the clinical journeys of participants over time. It enables clients to validate data completeness and filter participants by specific disease subtypes. Through visualization tools, users can identify incomplete or inconsistent records, such as participants with diagnostic codes but missing medication or event data, ensuring that downstream analyses are based on reliable datasets.
- By visualizing past timelines across diagnoses, treatments, and lab values, users can identify trends in disease progression, therapy response, and treatment switching. These insights support the identification of potential biomarkers and guide research on disease mechanisms and therapeutic strategies.
- Pharma teams can use this data to refine treatment pathways, define targeted cohorts by disease severity or medication use, or clinical events, and support data-driven research and clinical trial design.
The tool’s key features include:
- Credibility: Sources data from UK Biobank (UKBB), a highly credible and globally respected biomedical database.
- Interactive Dashboard: Enables users to search for participants by ID and view complete summaries, including procedures, treatments, and timelines.
- Flexible Timelines: Show how lab values, medications, and clinical events change over time, with clickable data points for deeper insights.
- Treatment Switching: Shows how treatments align with clinical events, revealing why participants switch treatments
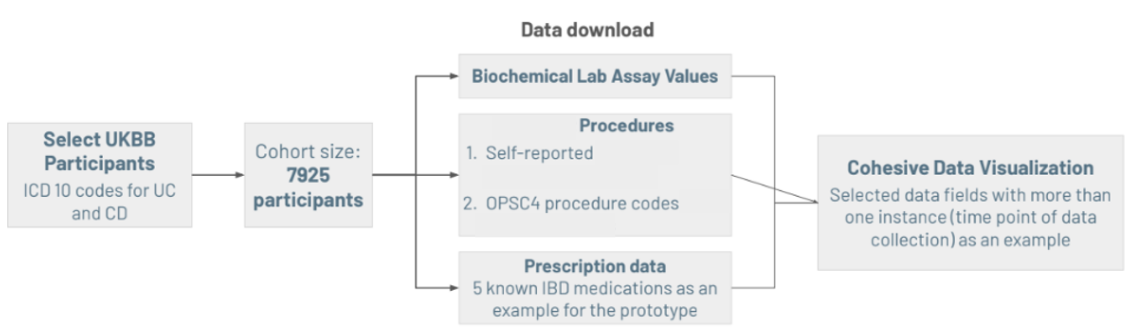
Clinical Journey Visualization Prototype Workflow:
The following are the key steps involved in the workflow from data to visualization:
- Selection of UKBB participants based on ICD-10 codes and determination of cohort size
- Download of participant data, including procedures, operation codes, diagnoses, prescriptions, lab values, and other relevant metadata (like lifestyle, family history questionnaire, etc.)
- Upload of data into the tool
- Comprehensive visualization of the integrated participant journey
(Note: UKBB has a host of different data types, and the data that has been downloaded and processed can be customized according to the disease/focus area.)
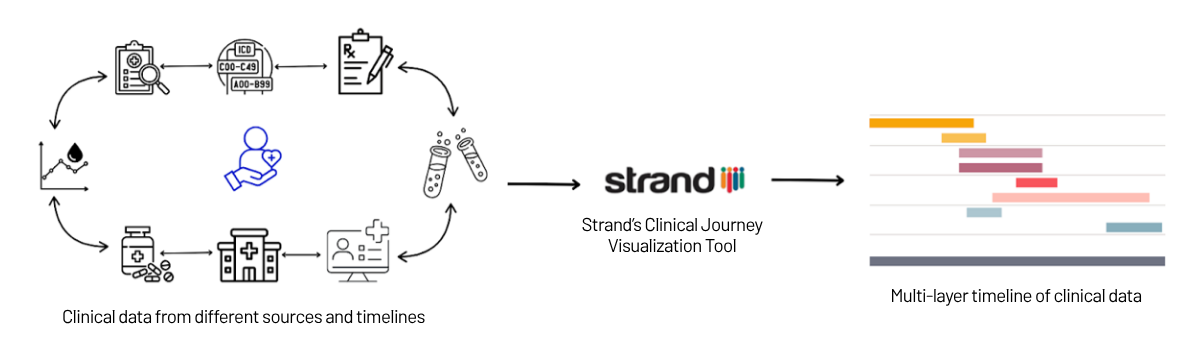
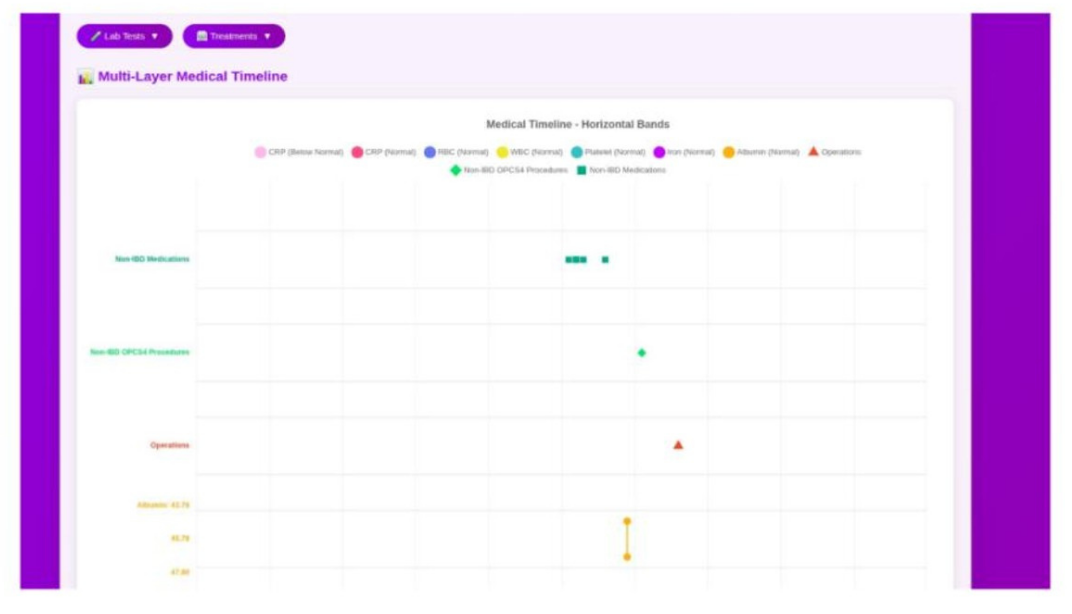
This workflow lays the foundation for building multi-layered medical timelines as shown in the picture below, connecting clinical events, treatments, and lab values into one cohesive, interactive view, helping teams move from raw data to real-world insights with clarity.
The portal will also soon enable data storage and deletion, secure logins, user management, and privacy controls, enabling users to access data without re-uploading, thereby supporting ongoing analysis and cohort management. Other upcoming capabilities include:
- A summary view for treatment pattern and trend detection with charts such as Sankey visualizations, to explore complex relationships.
- Summaries of All of Us data, enabling cross-cohort comparisons and the identification of trends across multiple disease subtypes. (Note: Individual-level data from All of Us cannot be downloaded; the portal will be able to show aggregated summaries where applicable.)
- Incorporation of genomic data visualizations, enabling users to integrate and interpret genomic insights derived from pipelines within and outside UKBB-RAP. (While UKBB genomic data cannot be downloaded directly, visualizations from genomic analyses conducted through other pipelines can be incorporated into the tool.)
While still in its early stages, the tool greatly simplifies and connects complex data. As it evolves, it can become a valuable resource for research teams aiming to better understand treatment patterns, outcomes, and clinical triggers, ultimately driving more effective care.
If you're interested in mapping participant journeys for better outcomes and exploring the tool further, connect with us for a quick demo!

Precision Medicine
11 Apr 2025
Strand’s GPU-powered cfDNA Workflow Delivers 3.5x Faster Processing at 2.6x Lower Cost

Strand’s Methylation Pipeline Series
24 Jan 2025
Strand’s Methylation Pipeline - An Overview - Part 2

Precision Medicine
30 Jun 2025
Strand’s Bioinformatics Expertise Enables Liquid Biopsy Assay Development for NSCLC with 70% Cost Reduction and 2–5% VAF Sensitivity
Let's Connect
Let's Connect

download the case study.