


Blogs
Strand’s Methylation Pipeline - An Overview - Part 2
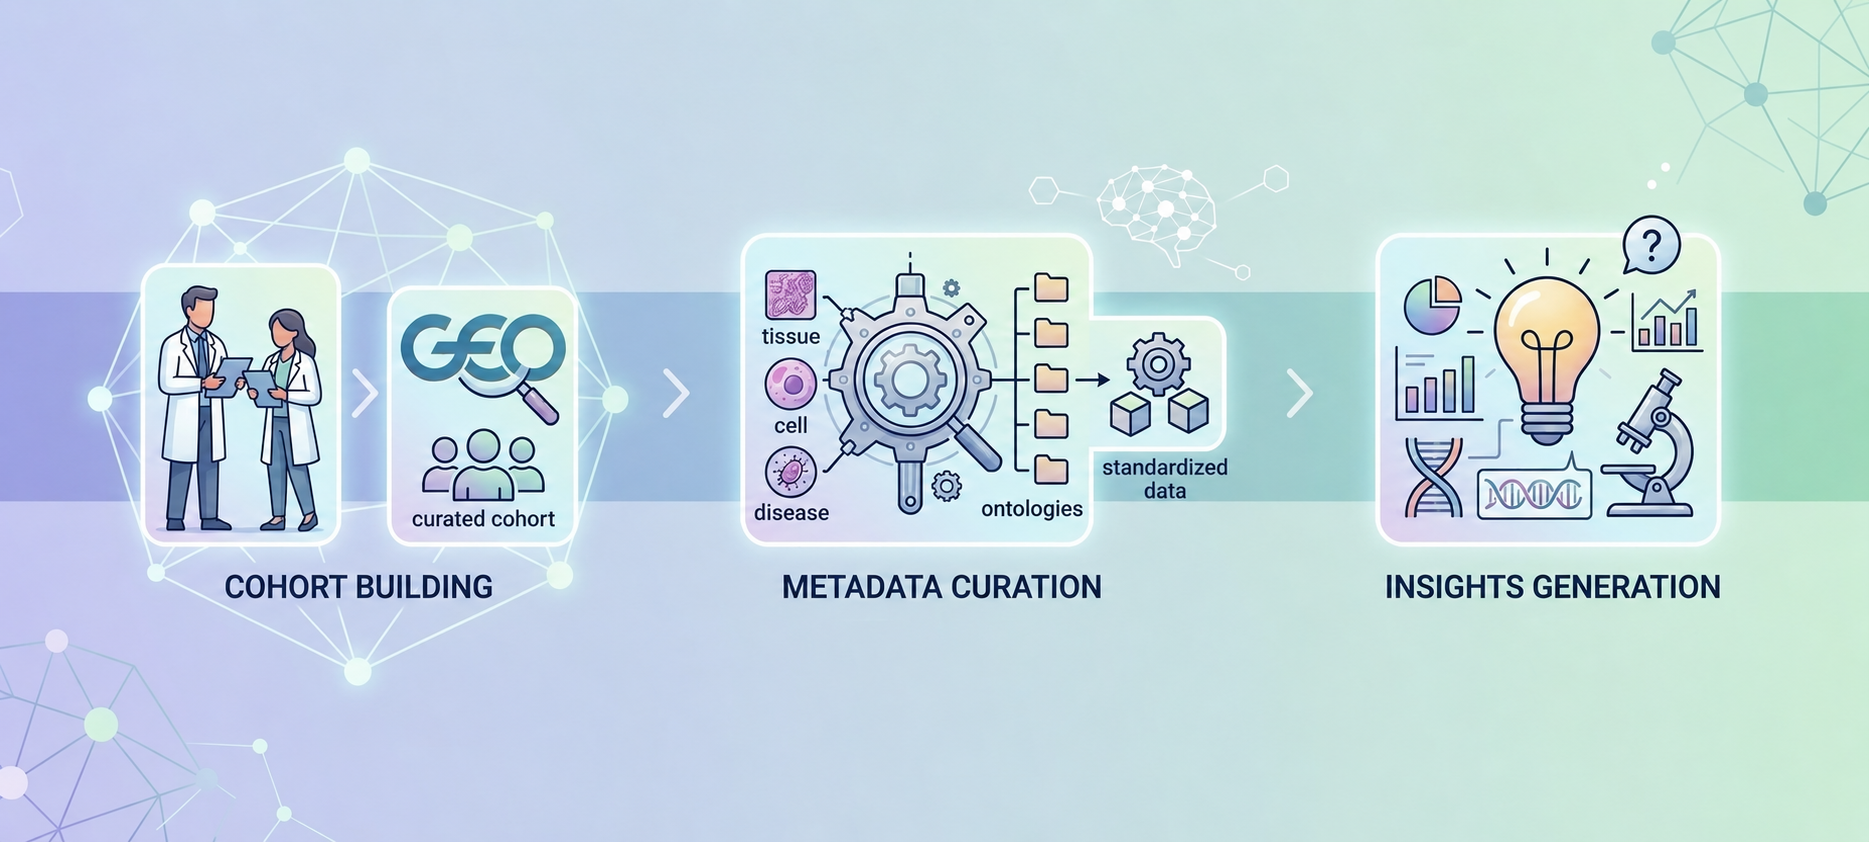
We previously talked about Strand’s methylation pipeline and the various tools involved. In Part 2, let’s dive into the StrandLS Methylation Analysis Platform and the protocol for new users to make the best use of it.
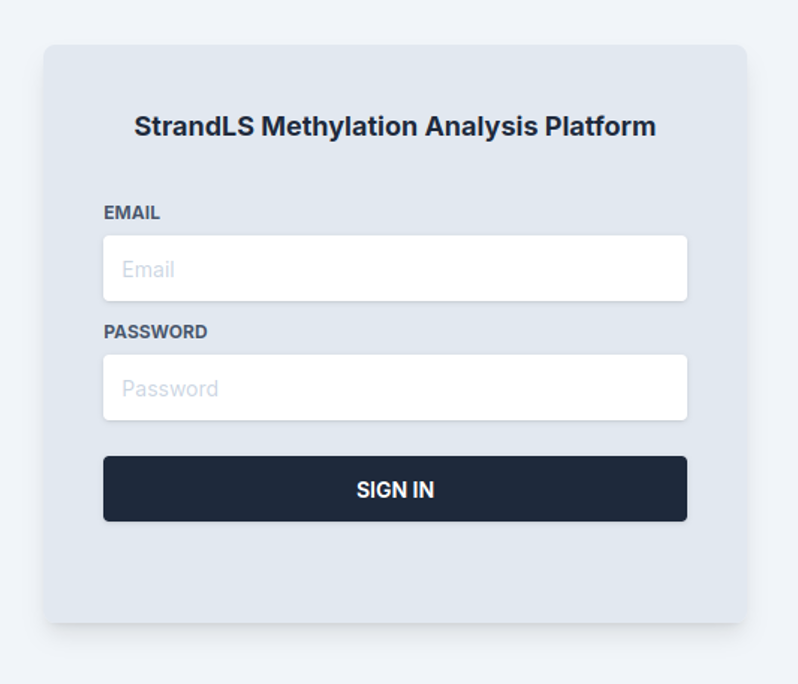
1. First, a user will need to sign into the portal with the provided credentials.
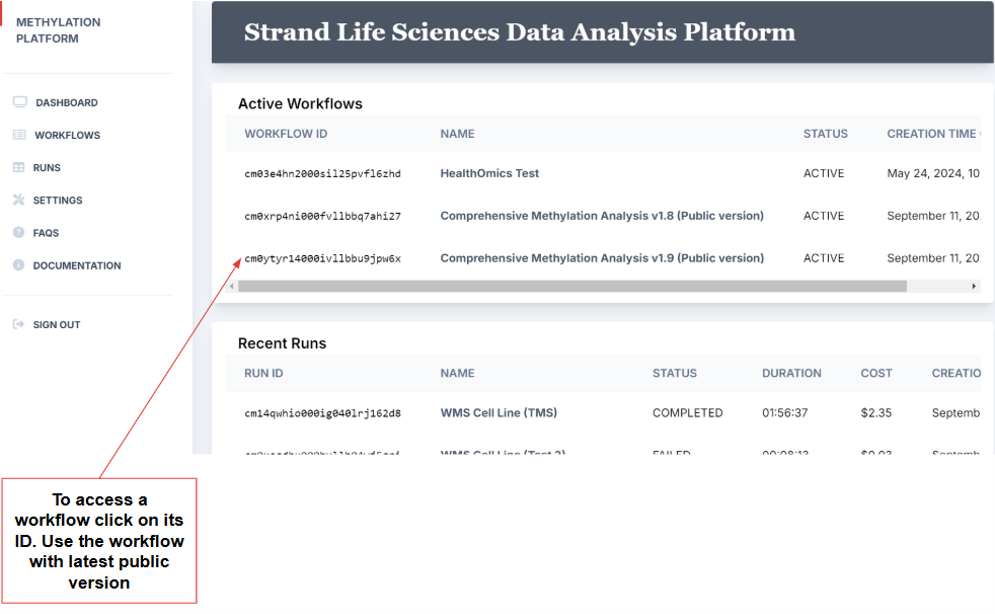
2. This leads to the portal home page, which includes the dashboard and a sidebar to navigate to various parts of the platform. The dashboard provides a glimpse of active workflows and recent runs.
3. Before setting up a run, a user must complete two tasks:
- Add their fastq files corresponding to R1 and R2 to the S3 bucket using the upload option.
- Create a “samplesheet”, which is a .csv file containing the description of the samples (i.e fastq files) and their S3 location (S3 URI). A samplesheet is formatted as shown below and the “sample” files should have a value that corresponds to the name of the Fastq files (common prefix from the fastq1, fastq2 and unique among different samples).
|
sample |
fastq1 |
fastq2 |
|
SRR29020038 |
s3://methylation-project/data/celllinewms/SRR29020038_1.fastq.gz |
s3://methylation-project/data/celllinewms/SRR29020038_2.fastq.gz |
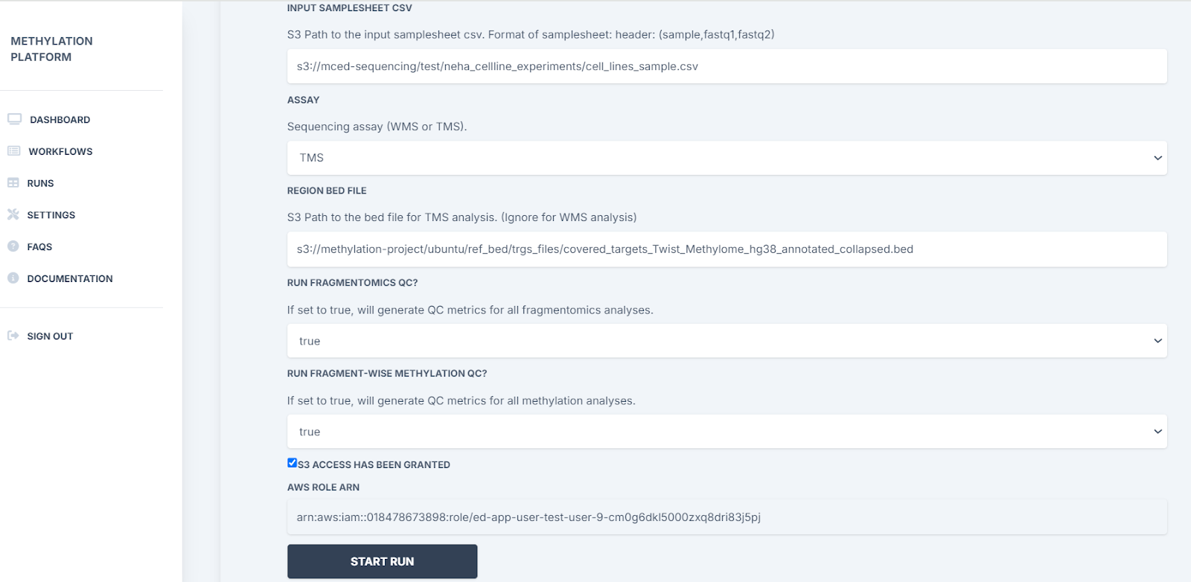
4. To set up the run, the user will then need to:
- Enter the S3 path to the input samplesheet csv (eg: samplesheet: s3://methylation-project/data/samplesheets/samplesheet_test.tsv)
- Select the type of methylation assay - targeted methylation or whole methylation
- Add S3 path to the bed file if TMS analysis
- Choose to run fragmentomics QC and fragment-wise methylation QC if applicable
- Click on Start Run
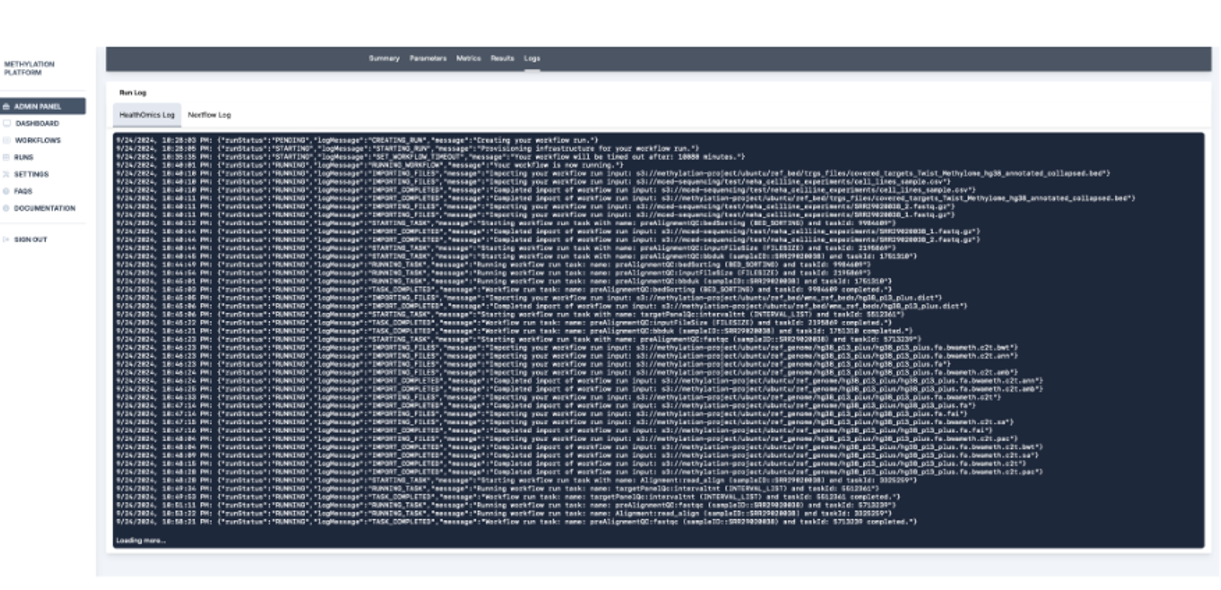
5. Run status and details of the progression are automatically updated. Here the user can stop the run if they wish to cancel.
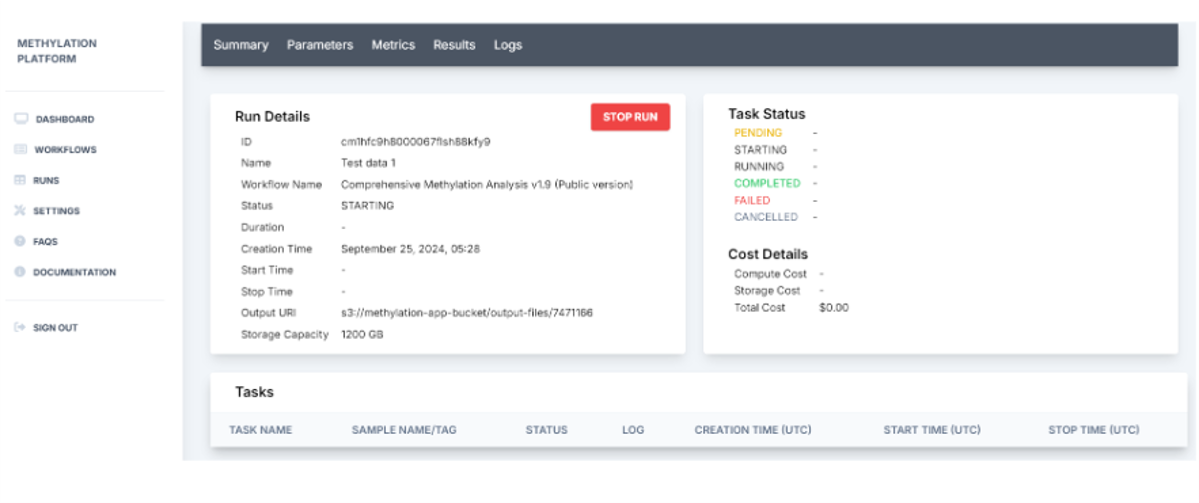
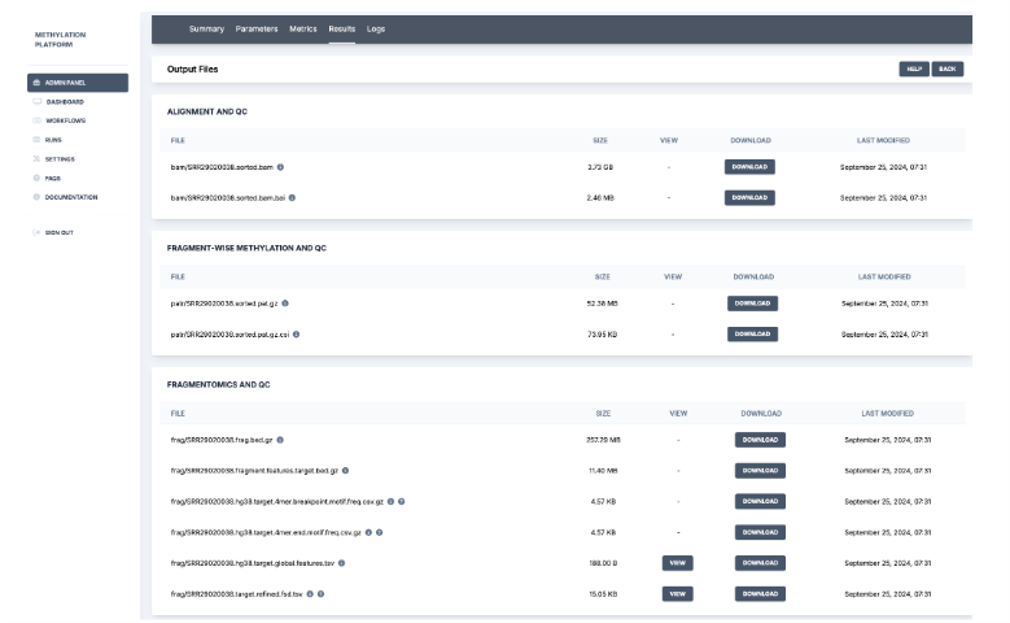
6. Post completion of the run, the platform generates a run summary where the user can view the run details such as status specific tasks, run duration, and output URI. HealthOmics exports output files to the specified S3 output location at the end of the run.
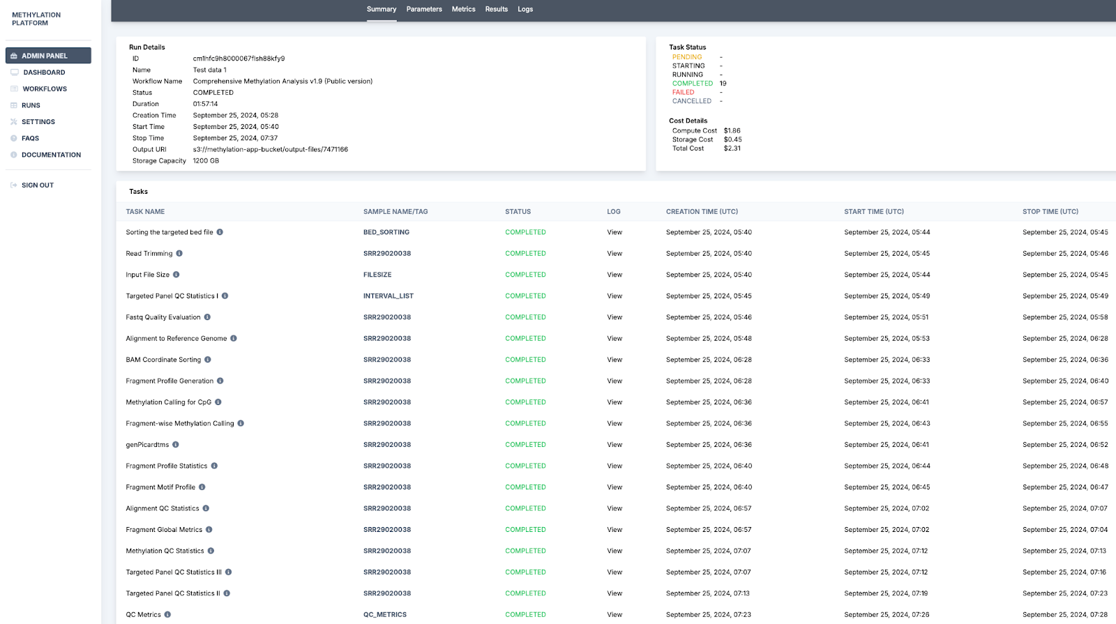
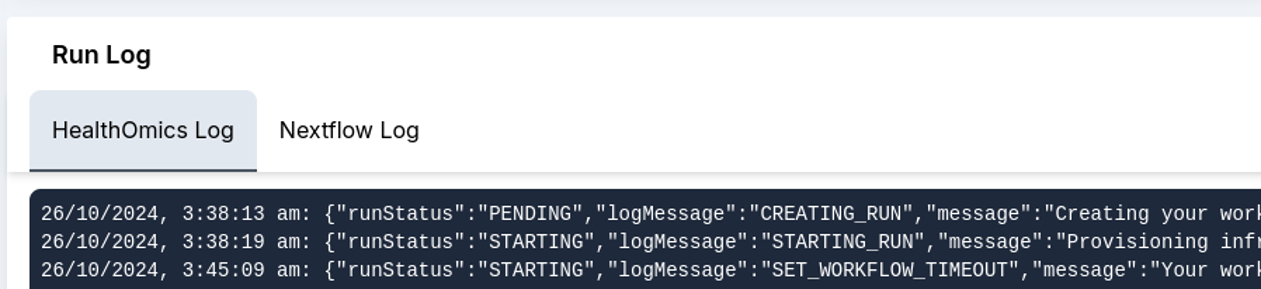
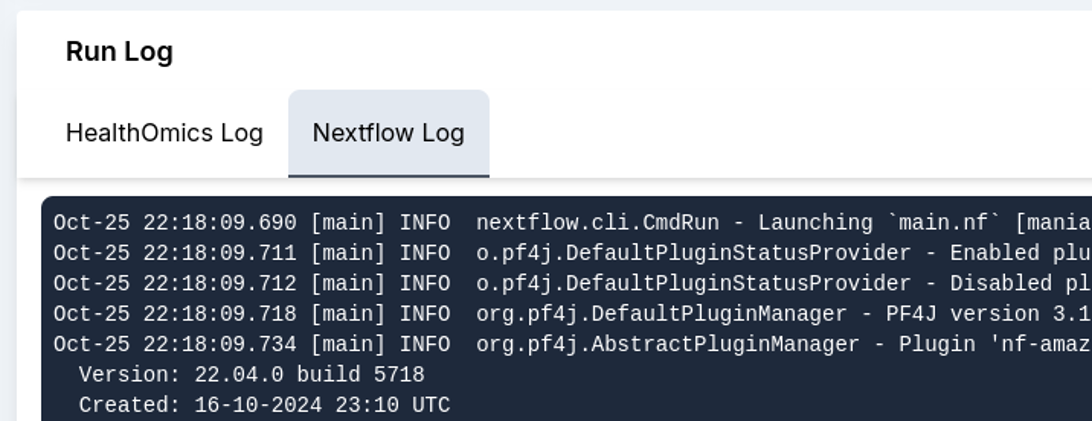
7. Further, run results and the run log are recorded. In this section, the Metrics tab with detailed cost analysis can be used to report usage, and the admin panel can be used to calculate user-wise and run-wise costs.
Overall, the StrandLS Methylation Analysis Platform enables users to effectively run their methylation pipelines while tracking necessary metrics.


Let's Connect
Let's Connect

download the case study.