


Blogs
Identification of SNP Markers in the Pm4b Gene of Wheat
Food: A primary source of essential nutrients to the whole world. When enquiring about one’s favorite food, we hear a variety of preferences from worldly cuisines. Many of these recipes have wheat as a common ingredient. Wheat is a grass variety cultivated for its edible grains and is widely used as a dietary staple. Despite large-scale cultivation, there is an increased demand to boost productivity due to diminishing land size and a growing population. Agronomic challenges, climate change, pests, microbial infections, natural calamities, etc., are some of the inhibitory forces affecting wheat crop yields.
Enhanced yields of wheat with superior qualitative and quantitative traits, and resistance to biotic and abiotic stresses are of utmost importance to improve food security. Genomic studies have advanced our understanding of the wheat genome, and certain loci have been identified as imperative for better survivability and growth. A deeper understanding of the wheat genome is also required for improved scientific interventions to increase yields. Identifying Single Nucleotide Polymorphisms (SNPs) in the wheat genome which are causative for enhanced adaptability of certain wheat cultivars in varied climatic conditions has been widely studied to improve crop yields. A change of one nucleotide (base) in certain positions of the genome is called a SNP and some SNPs help the crop to adapt better to biotic or abiotic stresses.
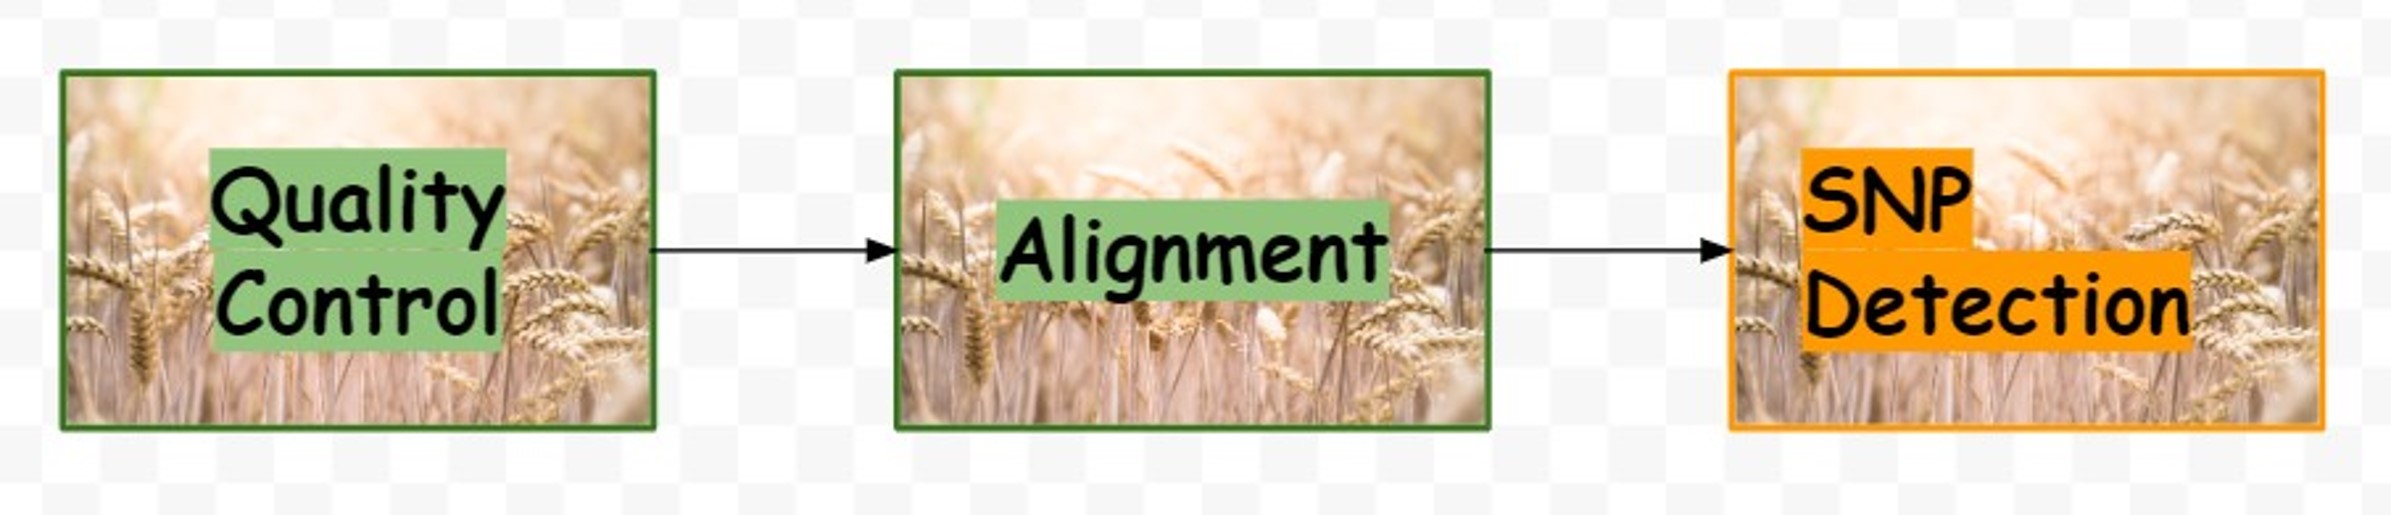
Powdery mildew is a fungal disease that affects wheat crops in cold and humid conditions. Pm4b is a gene in the wheat genome that has resistance to this fungal disease. Only certain breeds of wheat crop have the Pm4b gene. The use of molecular markers to identify the presence of Pm4b in a wheat plant can help in the selective breeding and cultivation of powdery mildew-resistant crop varieties. Molecular markers are specific DNA sequences or SNPs in the desired gene (Pm4b) and its surrounding sequences that can be used to identify the presence of the gene of interest. Most molecular markers of the Pm4b gene were not well known until a recent study1 identified these markers by identifying SNPs in sequenced samples from wheat crops with and without the Pm4b genes. Four samples from this study were analyzed using Strand NGS to identify SNPs present in these samples. This SNP analysis study is broadly categorized into Quality Control (QC), alignment with a reference genome, and identifying SNPs.
Pre-Alignment Analysis:
Sequencing is the process of determining the order of bases in the genome. A sequencer sequences a small piece of the genome called a read. Read sizes can vary from 50 to 1000 bases depending on the sequencing machine being used. Sequencers generate a large number of reads, which are saved as FASTQ files. A FASTQ file is a text-based format that contains the bases and their corresponding base quality (stored in ASCII values). Base quality is the probability score of a base being called out correctly. The FASTQ files, along with the sequenced data, can contain data resulting from instrumental errors. It is important to check for the quality of these files as these errors can lead to erroneous results in our analysis. Quality Control plots aid in identifying these errors.
Base Quality:
The base quality by position plot displays a box whisker plot with the base quality score of each base at a given position in all the reads. The blue line illustrates the mean for every base at a given position.
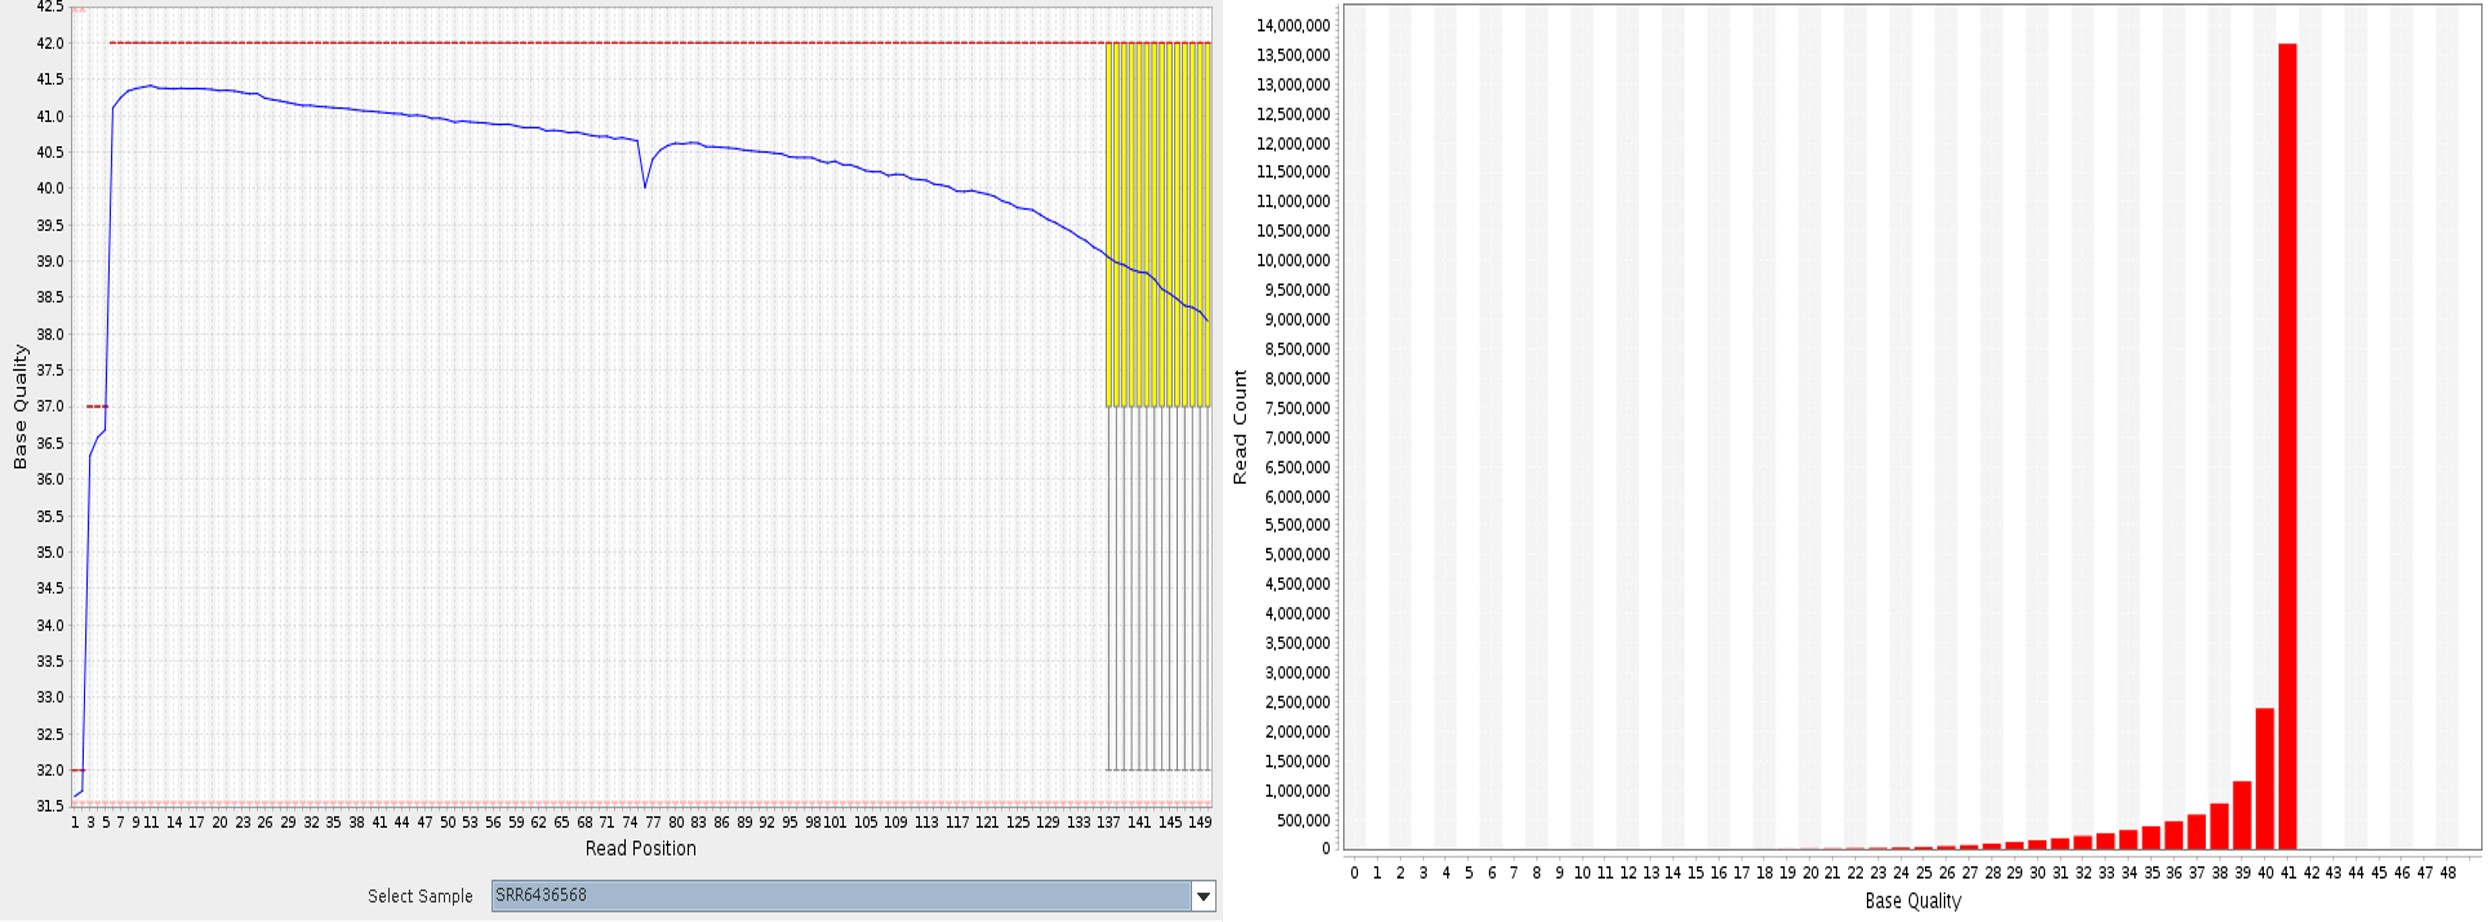
The Base quality histogram is a histogram of the distribution of base quality scores of all bases in all reads. In Figure 1, no whiskers are seen for most of the bases, and long whiskers are seen at the end of the read. This implies the probability of sequencing error at the end of the read as the sequencer might not have removed the previous base, or an appropriate base did not get attached for reading. The base quality score of 30 or above has a very low probability of error. All the bases in the reads have a mean base quality score above 30, and most bases have a base quality of 42. So, it can be concluded that the samples have fewer sequencing errors.
Base Composition:
Base composition by position plots the frequency of each base at all the base positions in all reads. All the bases have an equal likelihood of being at a base. Since there are 4 bases, it would ideally be 25 % for all reads.
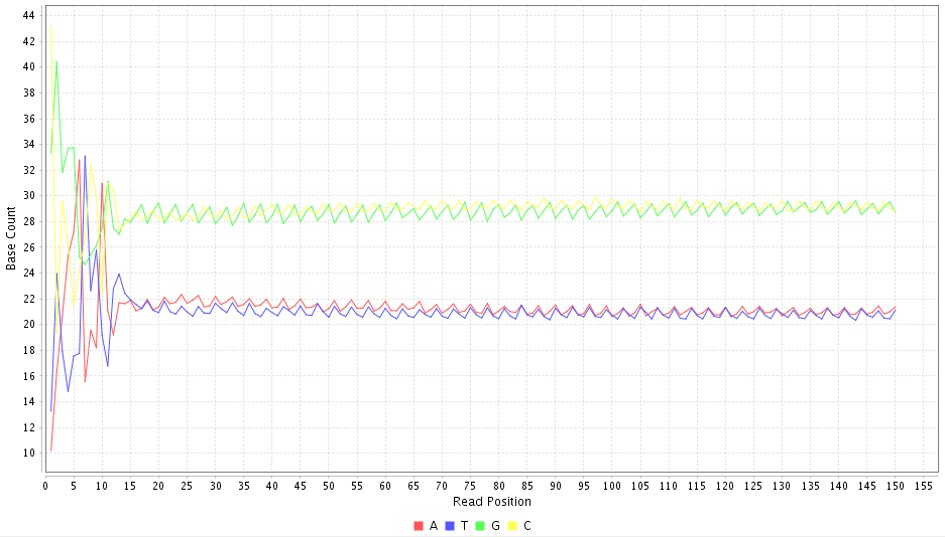
However, a read can vary with the percentage as each base is not distributed evenly in our genome. If there are higher deviations between bases, there is a chance of bias in the preparation of these reads. In Figure 2, all four bases lie within a probability between 20 to 30. This shows there is no bias in samples.
Adapter Content and Overrepresented sequences:
Adapter sequences are small nucleotide sequences that are attached to the reads. These adapters get attached or ligated to the flowcell of the sequencers and enable sequencing of the read.
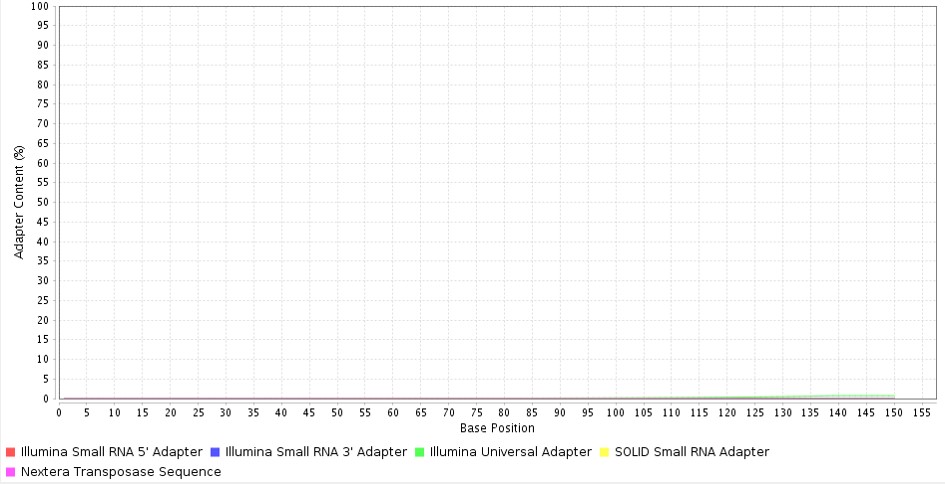
It is important to trim out these sequences from the reads during analysis as they disrupt the reading frame and also can be misaligned with the genome. In Figure 3, the commonly used adapter sequences (adapter sequences of Illumina, Nextera and SOLiD sequencers) are not seen, hence the samples are devoid of any adapter sequences. Sequence contamination can occur due to sampling contamination or the presence of some oligos during sequencing. The Overrepresented sequences QC showed no contaminants present in the sample.
Alignment:
The samples had a good base quality score and had no contamination sequences as concluded by the Pre-Alignment QC analysis. Once the quality control is done, the samples are aligned to a reference. Alignment is the process of aligning the sequenced reads to their genomic positions with the help of a reference genome. This alignment helps in identifying the genes or genomic position(s) to which the reads belong. Bases that have a mismatch with the reference genome or deletion or insertion of bases in the read are classified as SNPs.
Strand NGS uses its own algorithm called COBWeb for performing alignment. This algorithm can handle both longer and shorter reads and also allows for a different number of gaps and mismatches. Alignment was done for these samples against the IWGSC wheat reference sequence from Ensembl3 with a 90% percentage identity and 5% gaps.
Once the alignment was done, the aligned reads were available as “Aligned Reads List ” in the Experiment Navigator. The Alignment percentage of each sample can be seen in the Alignment Report.
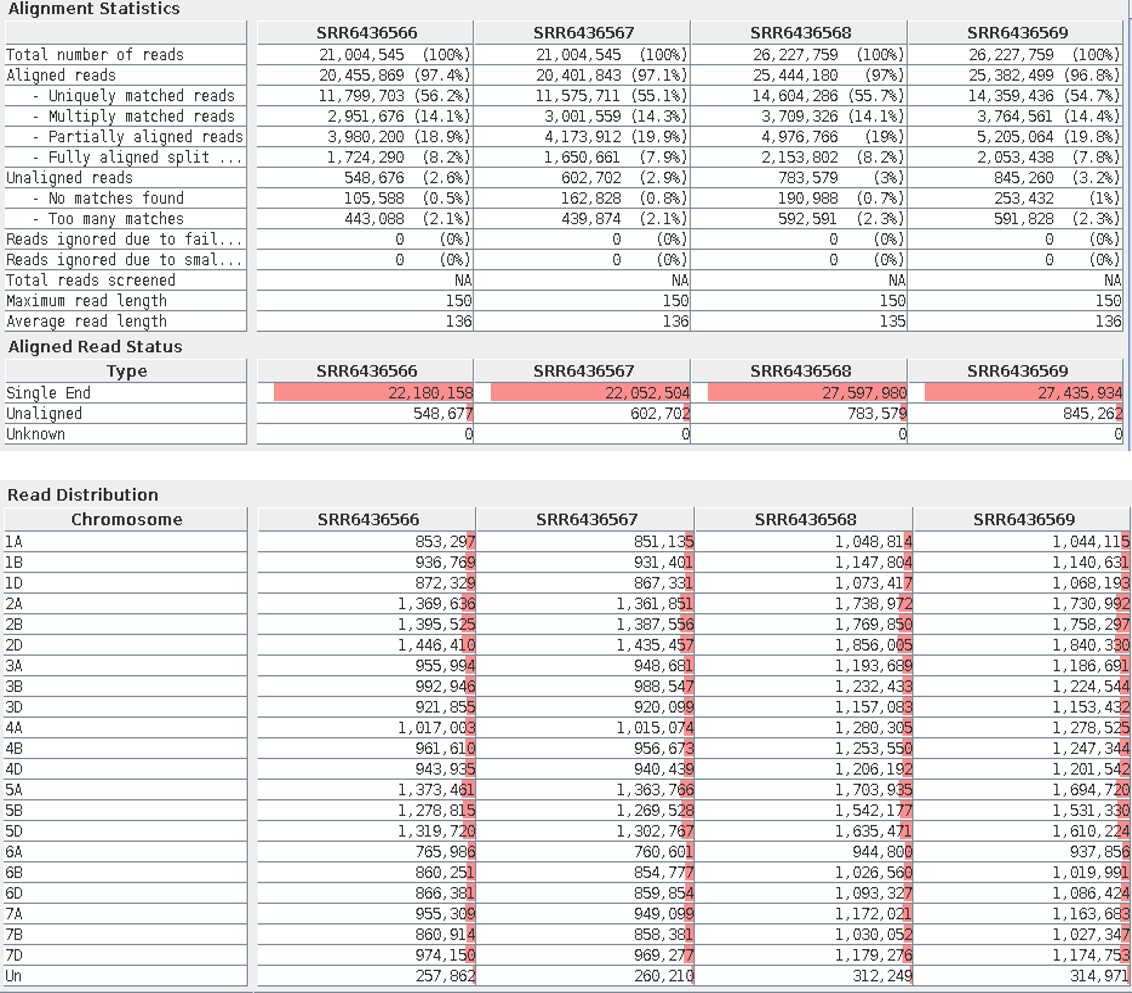
Nearly 97% of the reads have been mapped to the reference genome in all the samples. From this report, the aligned reads aligned only to one unique region of the reference genome, matched to multiple regions, and only partially aligned or split can be known. The reads that were not aligned to the reference genome due to no match or many matches could also be found. The aligned read distribution to each particular chromosome could also be known.
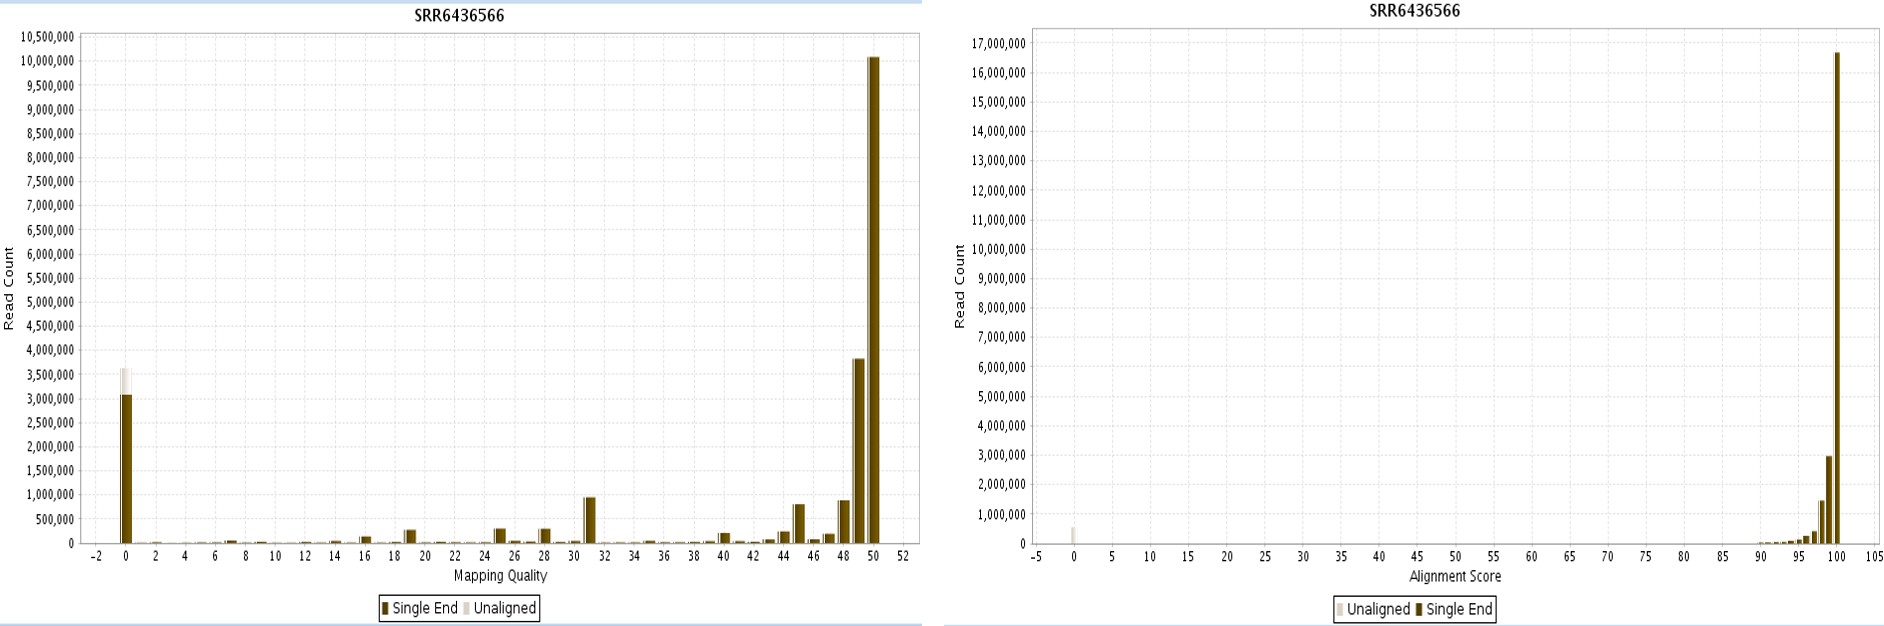
The quality of alignment can be checked by the Post-Alignment QC plots. Alignment Score plots illustrate the distribution of reads based on the alignment score. The alignment score is the percent identity found between read and reference. In Figure 5, most reads have an alignment score of 100. Mapping quality plots a histogram of mapping quality for all reads. Mapping quality is the probability score that calculates the probability of mapping being wrong. Mapping quality with scores over 40 indicates a low percentage (0.01%) of mapping error. In Figure 5, some reads have a mapping quality of 0 and most reads have a mapping quality >40.
This Aligned Read List could now be used to identify variants!
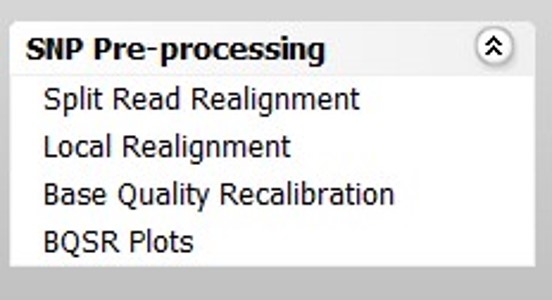
SNP Pre-processing:
Molecular SNP markers are regions of DNA with variations. They help in selecting desired traits for plant breeding. Pm4b is a gene of interest that imparts the desired resistance against powdery mildew, a fungal disease in certain breeds of wheat.
Samples with and without the Pm4b gene were taken for the identification of SNP markers that might assist in selective breeding. The SNPs are identified using the Aligned Reads List. Strand NGS utilizes the Bayesian SNP calling algorithm for SNP detection4. In the Aligned reads list, multiple changes or mismatches of base(s) can be seen. These mismatches could be variants or alignment errors. Some reads are misaligned due to sequence errors or consequent variations present in a read, and are called mapping errors. The Bayesian algorithm detects SNPs using base quality scores. There is a possibility that base quality could be under or overestimated, which could lead to the detection of erroneous SNPs. These artifacts can be removed by performing Local Realignment and Base Quality Recalibration steps using the SNP Pre-processing steps in the Strand NGS workflow.
Local Realignment:
In Figure 7, the All Aligned Reads have certain reads with base G as an insertion (purple) and a mismatch and certain reads have both Gs as mismatches. If we locally realign the first mismatch G as an insertion, we can see that all reads align within the same region.
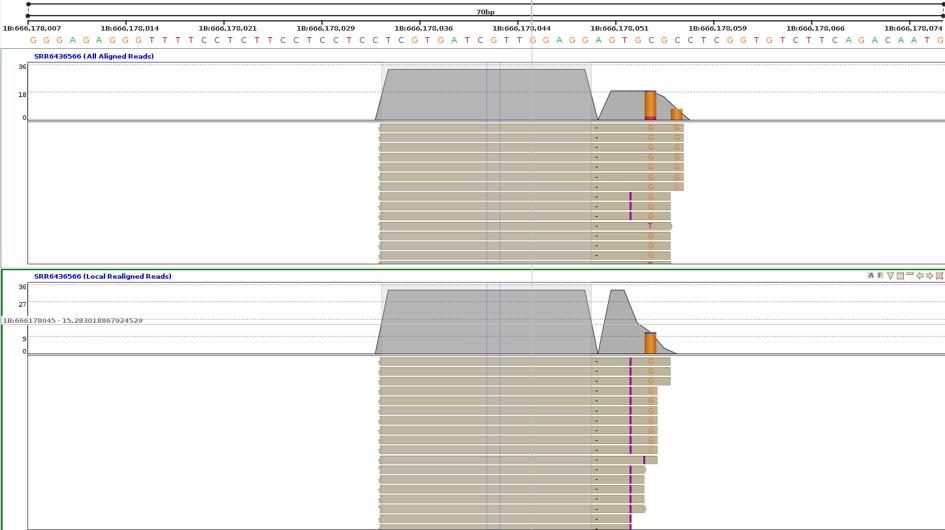
Local realignment of reads helps in finding the right variants. The locally realigned reads are saved as Local Realigned reads, a node under All Aligned reads. Strand NGS identifies regions with closely located multiple variations. These regions are identified based on parameters like the minimum number of nearby variations and the possibility of these variations being merged. The software then identifies the type of variations within these regions and scores each variant based on the supporting reads, the probability of variation, etc. The highest-scoring variation is inferred as the most likely variation. All the reads are then realigned according to the most likely variation, which is determined based on the probability scores of each variation, considering error rates and alignment offset.
Base Quality Recalibration:
When a specific base repeats itself in a DNA sequence, the sequencer may erroneously sequence the subsequent base(s) due to this repetition. Thus, the accuracy of a base call depends on the adjacent base. Different sequencers (like Illumina, PacBio, etc.) use different types of sequence cycles to sequence reads and this contributes to the base quality.
Strand NGS recalibrates the base quality based on these factors to minimize errors. It categorizes all bases with mismatches into bins according to the described factors. Based on the mismatches and the total number of bases, the base quality scores are recalibrated.
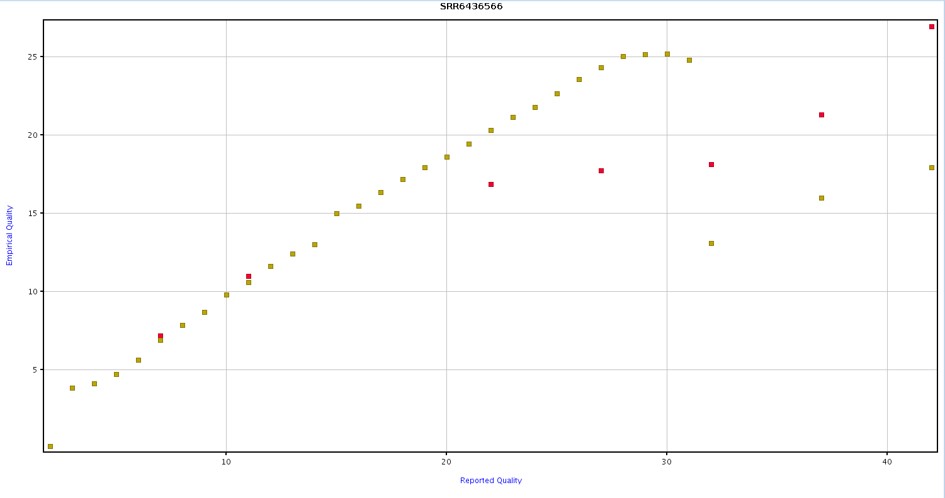
In Figure 8, the yellow bins represent the recalibrated base quality scores, aligning closely with an identity line (x-axis value equals y-axis value), indicating that the reported (x-axis) and empirical (y-axis) qualities tend to match after recalibration.
SNP Detection:
The SNPs are identified by the SNP Detection workflow under Sequence Analysis. This calculates the probability of a variant occurring given the observed data. The probability of the variant and the observed data are calculated based on the number of supporting reads, base quality, error rates, etc. These parameters can be customized in the SNP Detection wizard. The output of SNP Detection is the SNP Multi Sample Report under the read list. The Recalibrated Local Realigned Reads of wheat samples contained 115,810 SNPs.
Significant SNPs:
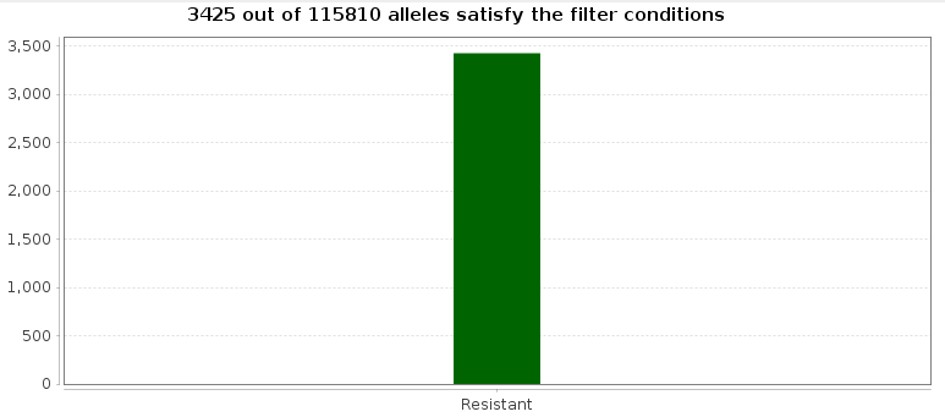
SNP markers should be present only in samples with resistance to Pm4b and should have high confidence (supporting reads) and coverage. The SNP Multi Sample Report was filtered based on high confidence, coverage, and presence in the group of Resistant samples using Find Significant SNPs. 3425 variants were found to be significant.
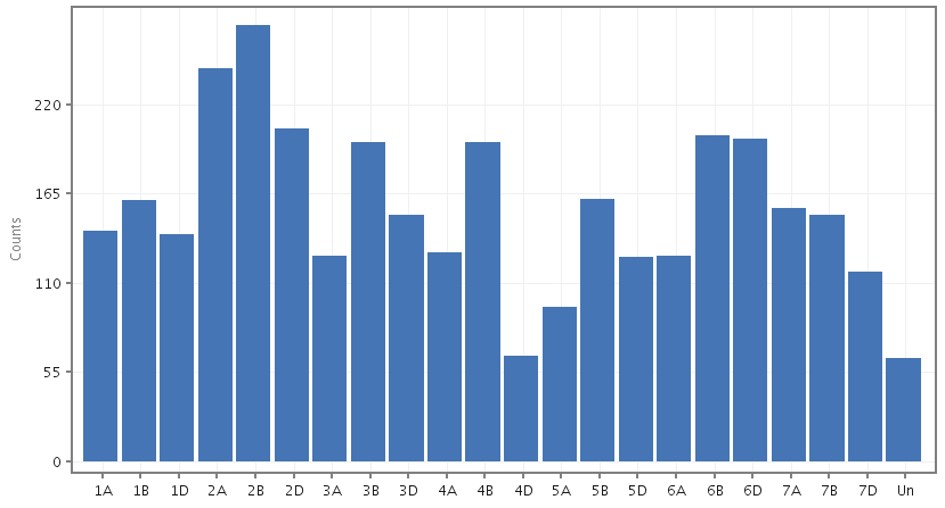
The Pm4b gene is located in the distal region of the 2A chromosome1 of wheat, which had 242 SNPs as observed from Figure 5. SNPs in chromosome 2 were observed using the genome browser. The genome view in the genome browser was used to highlight the distal region of chromosome 2.
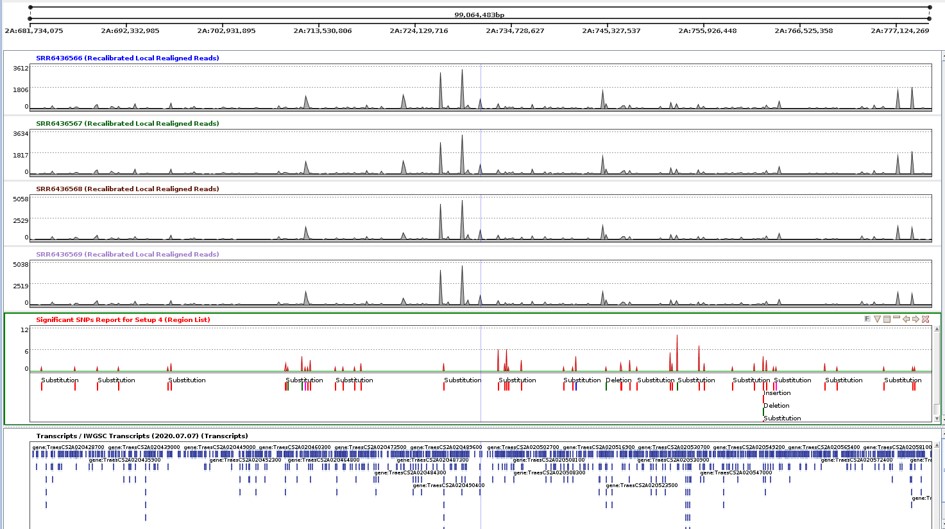
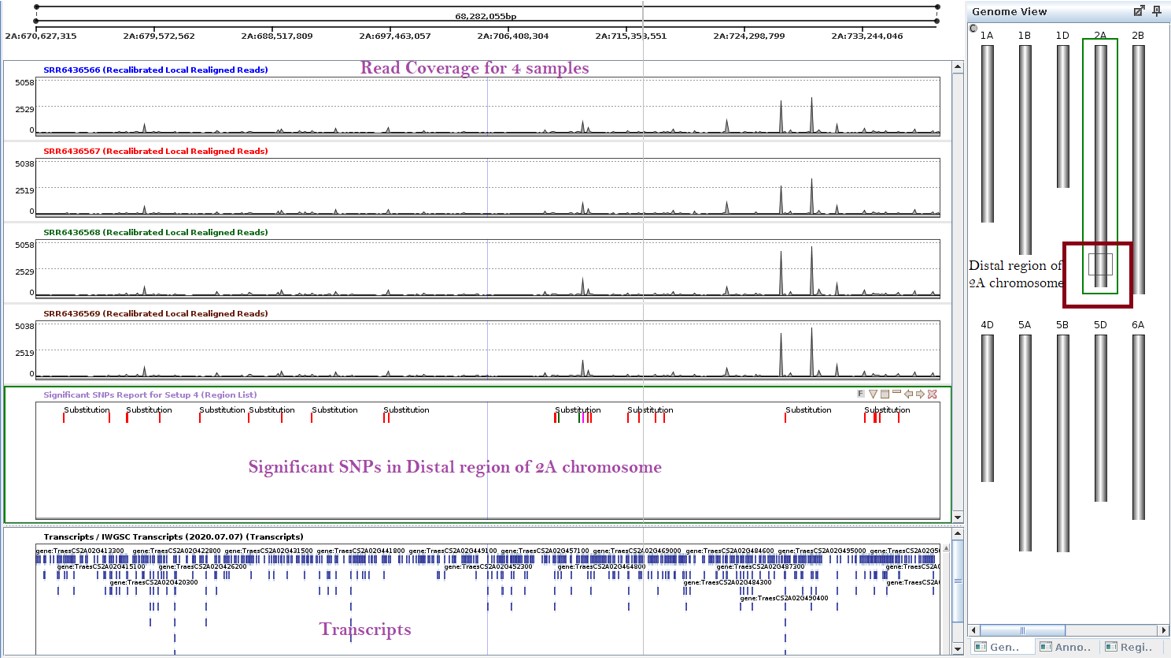
Figure 11 shows the coverage of all four samples, the significant SNPs found in the 2A chromosome, and the transcripts. In Figure 12, The Genome view shows the region under examination in the genome browser. The distal region was selected to identify SNPs in that region. 55 SNPs were present in the distal region. These SNPs could be considered as potential markers for selective breeding.
Now, these SNPs should be experimentally validated to determine if they could be considered as biomarkers for Pm4b selection. This validation could facilitate the identification of potential biomarkers, helping to mitigate the agronomic challenges faced.
References:
- Wu, P., Xie, J., Hu, J., Qiu, D., Liu, Z., Li, J., Li, M., Zhang, H., Yang, L., Liu, H. and Zhou, Y., 2018. Development of molecular markers linked to powdery mildew resistance gene Pm4b by combining SNP discovery from transcriptome sequencing data with bulked segregant analysis (BSR-Seq) in wheat. Frontiers in plant science, 9, p.95.
- International Wheat Genome Sequencing Consortium
- Triticum aestivum Assembly and Gene Annotation
- StrandNGS


Let's Connect
Let's Connect

download the case study.