


Blogs
RNA Expression Analysis: HY5-The Light Switch of Plants
Childhood memories of summer vacation involved watering the plants and taking care of my parents' garden. It was filled with fun and intrigue as a new shoot with small leaves would sprout from a potato bud, or, out of nowhere, a “Touch me not” plant would grow, and when touched, its leaves would shrink. Plants respond to stimuli such as touch, light, water and soil, and have the necessary adaptations to respond to them.
Since then, these kitchen gardens have seen a lot of experimentation. Experiments included observing how plants grew under different lights (red, blue, and white), how they responded in the soil and in pots, and whether they grew taller when exposed to piano or guitar music. All these experiments proved that plants respond to stimuli quickly, and some (especially 80’s rock 'n' roll) helped them grow well.

Figure 1: A plant receiving its first light
De-etiolation of plants
One response process is to see how seeds respond to light. Seeds undergo a process called etiolation when not exposed to light; they promote longer hypocotyl (to become stems) growth to reach the soil surface faster and have closed cotyledons that lack chlorophyll. They de-etiolate when first exposed to light. This exposure causes the plant to grow chloroplasts, develop cotyledons, and slow the rate of hypocotyl growth.
This response of plants poses a question: What is the molecular basis of this differential response to the availability of light? Many researchers have identified transcription factors and genes responsible for these responses. A recent paper by Burko, Yogev, et al. discusses the role of the transcription factor HY5 in the de-etiolation process of plants. The HY5 transcription factor regulates gene expression, and some of the primary genes can be identified by RNA-Seq data from thale cress (Arabidopsis thaliana).
To understand the role of HY5, plant mutants without HY5 (hy5), a silencing factor of HY5 (HY5-SRDX), an activator of HY5 (HY5-VP16), a native type (HY5-OX), and control Columbia 0 (Col) were sequenced immediately upon exposure to light. The sequence files were aligned and quantified. This data was used to check if HY5 regulates the de-etiolation process, shifting experimentation from a backyard garden to a laptop.
Null Hypothesis: HY5 regulates the de-etiolation process
Interpreting the Transcribed Transcription Factor
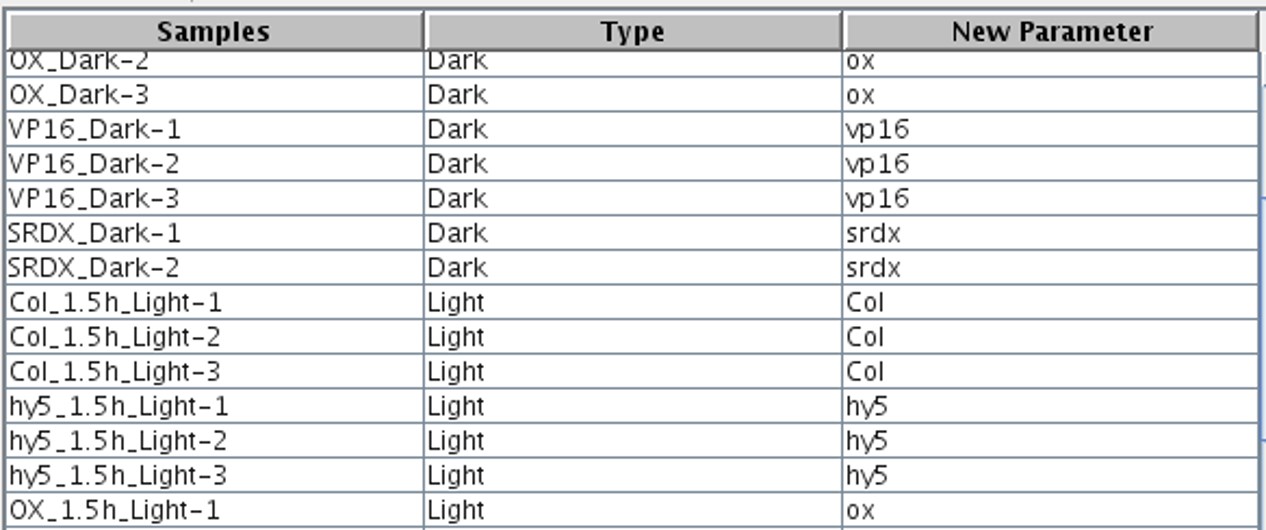
A new RNA analysis experiment was created in Strand NGS software using the quantified files. Once the experiment was set up, the samples were grouped according to their types, and interpretations were generated (Figure 2). This labeling of plants, derived from the paper1 helps identify the groups they belong to. Once labeled, we can differentiate how they respond to the stimuli.
After the experiment is created, the expression patterns of all genes in all samples can be visualized using various plots:
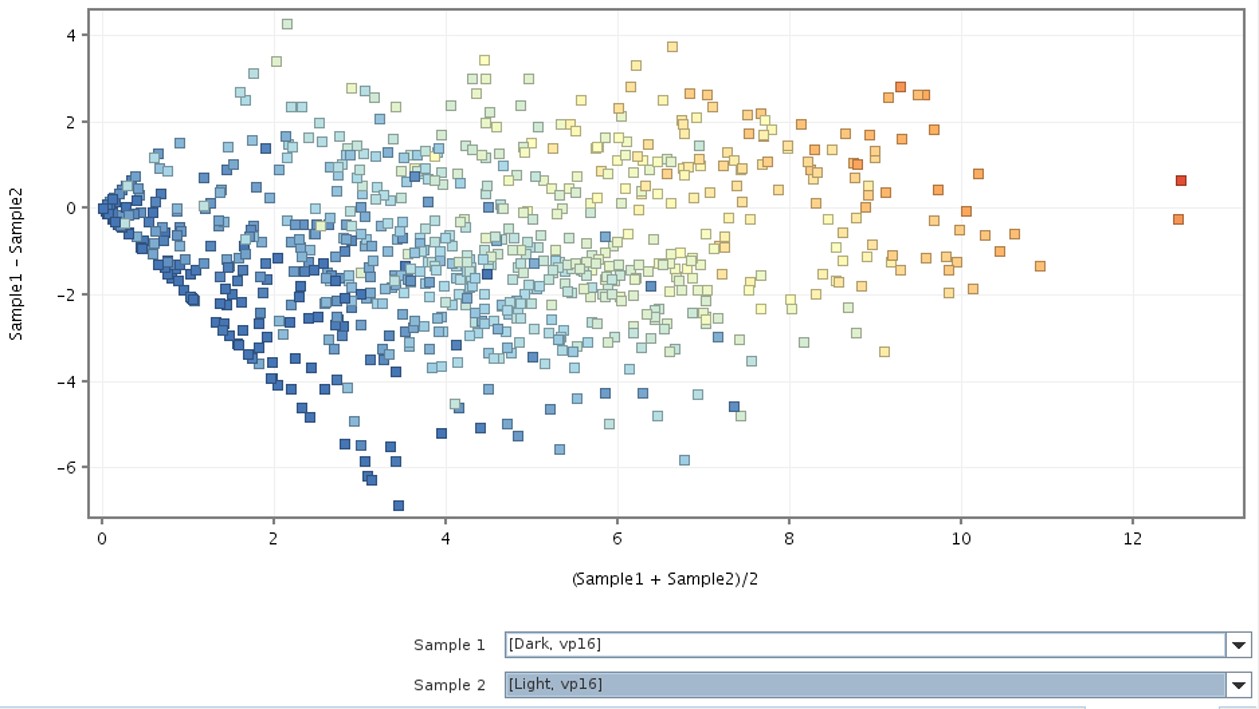
The scatter plot (Figure 3) illustrates the mean and differences in gene expression between the two samples, providing insight into how the genes are scattered across the samples.
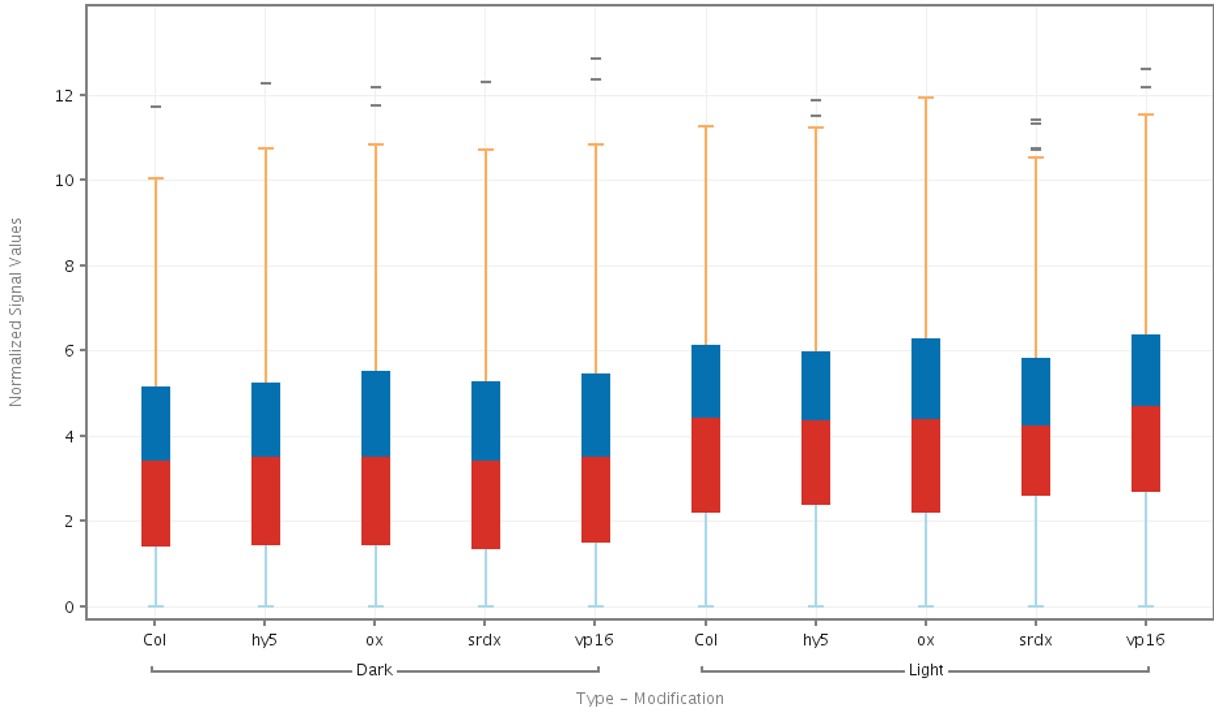
The box plot (Figure 4) displays a box-and-whisker plot of the overall gene expression values across genes in each sample.
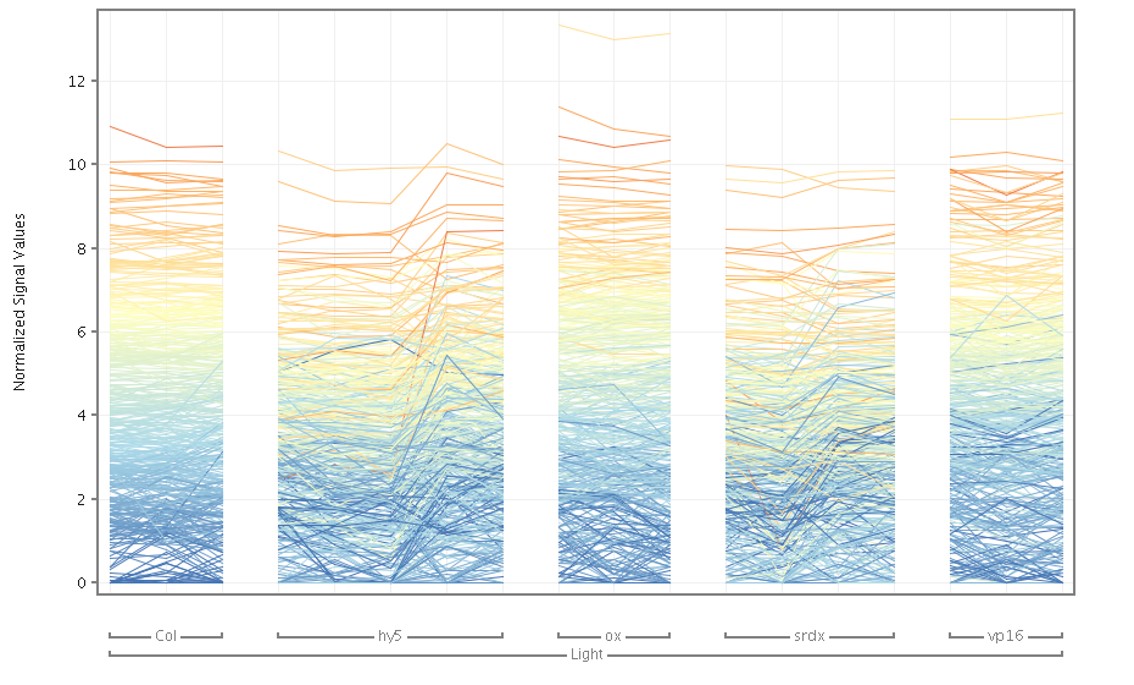
The profile plot (Figure 5) shows the expression values for samples based on the grouping information provided.
In the garden, responses were measured from morphological characteristics such as stem length, leaf color, and which plant flowered first (also called phenotype changes). Genotype changes can be observed through changes in gene expression. Using the grouping, the differential gene expression between these HY5 groups can be identified.
Differential expression across groups was analyzed using ANOVA, and the Benjamini-Hochberg correction was applied with a p-value cutoff of ≤ 0.05 and a fold change ≥ 1 with respect to the no HY5 mutant (hy5). 6561 genes were found to be differentially expressed (Table 1).
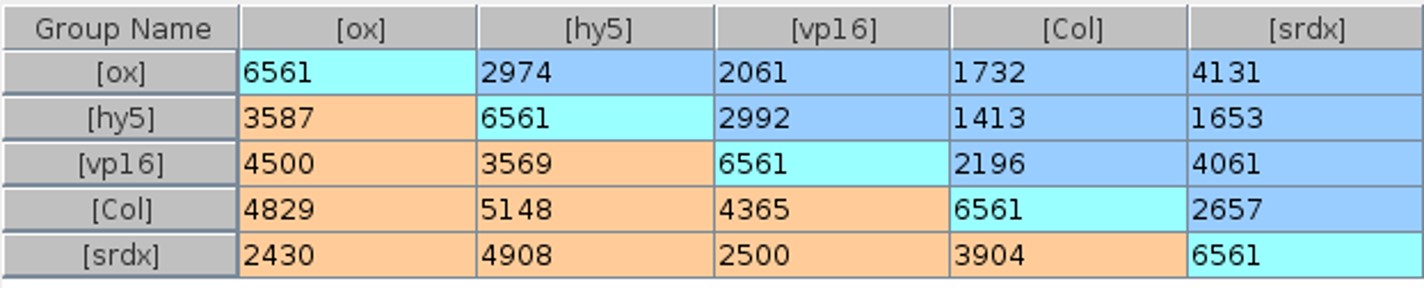
These genes are expressed when HY5 is active. Silencing domains in HY5-SRDX ideally silence the genes that bind to them, and activating domains in HY5-VP16 activate the gene. Thus, a gene that binds to HY5 will be downregulated in HY5-SRDX and upregulated in HY5-VP16. This mechanism reduces false positives. Differential expression of HY5-SRDX and HY5-VP16 was analyzed to identify genes that do not exhibit this effect. 820 genes met this criterion.
Can the samples be clustered based on these 820 genes? PCA and hierarchical clustering were performed based on these 820 genes on the plants exposed to light.
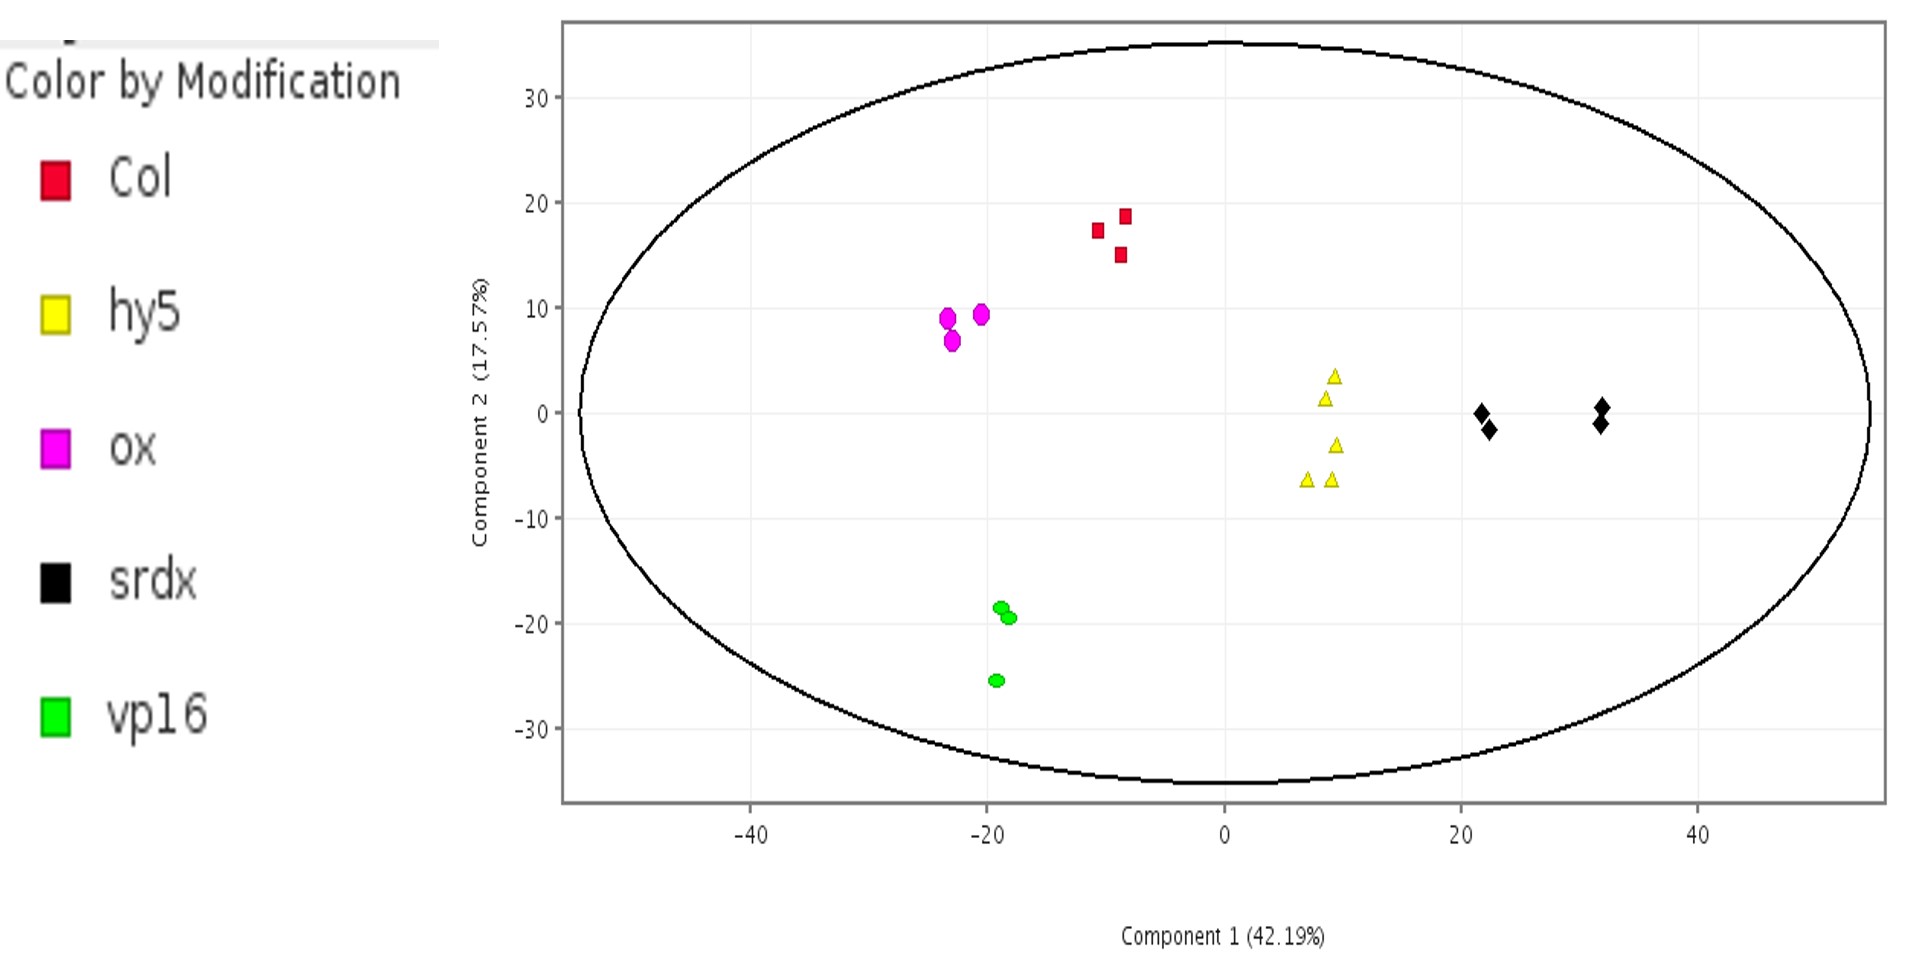
The PCA plot (Figure 6) distinctly separated the five samples into separate clusters, with HY5-SRDX samples far from the HY5-VP16 samples. HY5-Col and HY5-OX samples, being native forms of HY5, are clustered near each other and have nearly the same Principal Component-1 value as that of HY5-VP16. Samples from the groups HY5 and HY5-SRDX are clustered together as they do not express the HY5 gene.
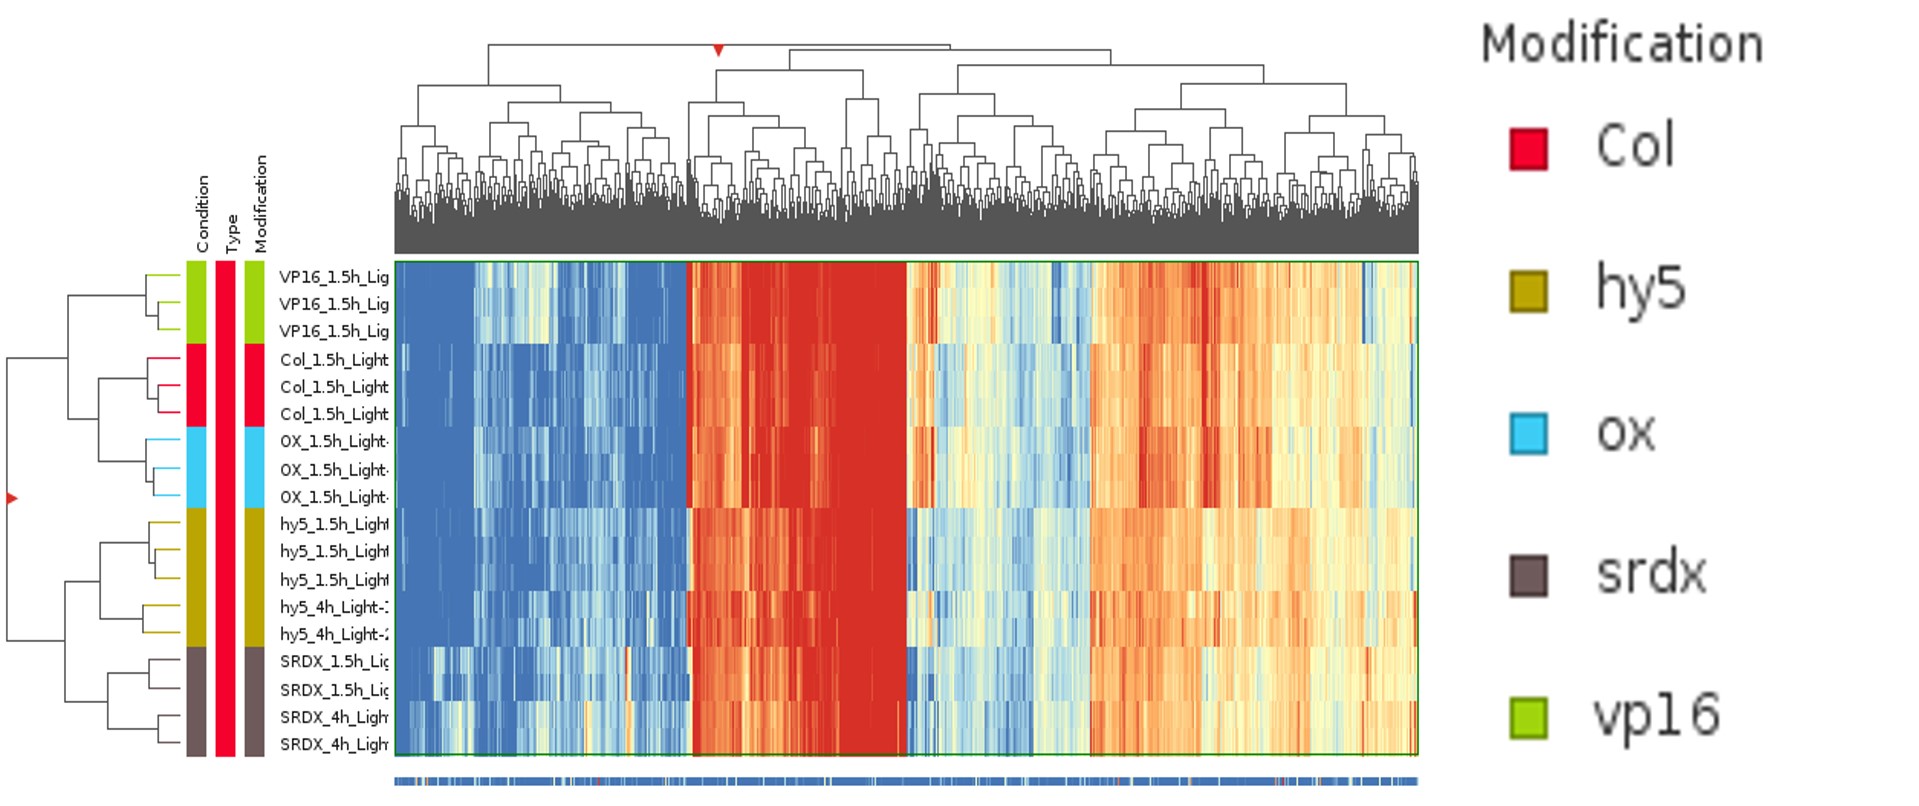
Hierarchical clustering (Figure 7) clusters the samples similarly to the PCA. Hence, it is clear that the 820 genes are expressed by HY5.
So, what do these 820 genes do, and how are they biologically relevant? A GO-Analysis with a p-value cutoff of 0.1 was run to explore this. The top significant GO processes identified can be seen in Table 2.
The GO terms specifically indicate a response to stimuli. Hence, it can be concluded that HY5 aids in the de-etiolation process of plants.
Null Hypothesis accepted.
It was fun to recreate and analyze an experiment in silico to understand how HY5 influences plant responses. Now, you can also analyze your garden observations using Strand NGS as described!
Reference:
- Burko, Yogev, et al. Chimeric activators and repressors define HY5 activity and reveal a light-regulated feedback mechanism. The Plant Cell 32.4 (2020): 967-983.

Precision Medicine
09 Mar 2026
Strand’s Approach to Delivering Scalable, Clinical-Grade AI Infrastructure for Digital Histopathology

Precision Medicine
27 Mar 2023
Chris Hemsworth and the risk of Alzheimer’s Disease

FDA Rule on Lab Developed Tests (LDTs)
12 Aug 2024
FDA Final Rule Affects Regulatory Oversight of LDT Manufacturers
Let's Connect
Let's Connect

download the case study.